Comparing President Trump’s Record to His 2016 Agenda
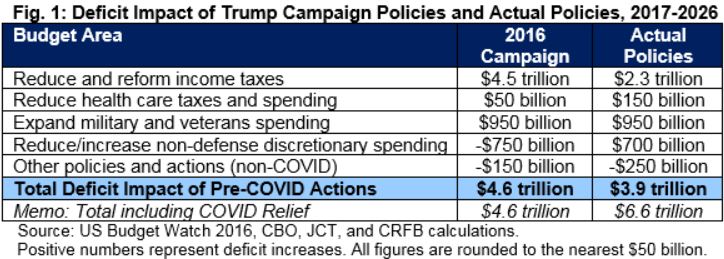
During the 2016 campaign, US Budget Watch estimated that then-candidate Donald Trump’s proposed agenda would add $4.6 trillion to budget deficits between 2017 and 2026, excluding interest. Between taking office and the start of the COVID crisis, we estimate the President’s actual actions have increased deficits by $3.9 trillion. That figure increases to $6.6 trillion when COVID relief measures are included.
While the President’s actions since taking office have differed in many ways from his campaign proposals, the overall fiscal impact of legislation and executive orders he has signed has been similar. Of the $3.9 trillion in higher deficits, $2.3 trillion is from reducing taxes, $950 billion from increasing defense and veterans spending, and $700 billion from increasing non-defense discretionary spending.
It is important to note that this debt was also approved by Congress, about half on a broad, bipartisan basis.
We estimate that taken together, these $3.9 trillion of tax cuts and spending will lead to about a 15 percent of GDP increase in debt by 2026. They explain the majority of the difference between CBO’s 2016 debt projection of 86 percent of GDP in 2026 and its current projection of 107 percent of GDP, the highest level in our nation’s history.
This paper is part of US Budget Watch 2020, a project focused on the fiscal and budgetary impact of proposals put forward in the 2020 presidential election. You can click here to read the analyses, explainers, and fact checks we’ve produced to date. US Budget Watch 2020 is designed to inform the public and is not intended to express a view for or against any candidate or any specific policy proposal. Candidates’ proposals should be evaluated on a broad array of policy perspectives, including, but certainly not limited to, their approaches on deficits and debt.
How Has the President’s Fiscal Record Differed from His 2016 Agenda?
During the 2016 campaign, we estimated that candidate Trump’s plans would increase deficits by $4.6 trillion between 2017 and 2026, excluding interest, under our central estimate. Actual legislation signed and executive actions taken during the Trump administration prior to the COVID crisis have added $3.9 trillion over the same period.
Of the $4.6 trillion estimated cost of President Trump’s 2016 campaign agenda, $4.5 trillion stemmed from a set of proposals to significantly reduce and reform taxes for individuals, businesses, and estates. The President’s health care policies cost another $50 billion on net – with the lower health-related tax collections outweighing lower health spending. An additional $950 billion of costs came from proposed defense and veterans spending increases. Offsetting some of these costs, the Trump campaign proposed reducing non-defense discretionary spending by $750 billion and cutting other spending by $150 billion.
Our full analysis of President Trump’s 2016 campaign agenda is available here.
Actual legislation and executive actions signed by the President have differed substantially from what was proposed during the campaign, but have had a similar overall fiscal impact.
The deficit increases in some policy areas are close to our 2016 estimates of the campaign’s proposals. For example, spending on defense and veterans has increased by $950 billion – the same figure we estimated in 2016 – though a larger share is on the defense side and a smaller share is going toward veterans. We also estimate the health policy changes signed by the President – including the repeal of many Affordable Care Act (ACA) taxes and the individual mandate penalty – have a similar fiscal impact to his original proposal to fully repeal and replace the Affordable Care Act and block grant Medicaid ($150 billion compared to $50 billion).
On the other hand, tax cuts and reforms signed into law by the President – mainly the 2017 Tax Cuts and Jobs Act (TCJA) – were half as large as those proposed in the 2016 campaign ($2.3 trillion versus $4.5 trillion). And while the President’s campaign proposals would have reduced non-defense discretionary (NDD) spending by $750 billion over a decade, he signed into law two bipartisan budget agreements that increased (non-veterans) NDD spending by $700 billion.
The President has also signed laws and executive orders for $2.7 trillion of relief related to the COVID-19 pandemic and economic crisis, which was not foreseen during the 2016 campaign and thus not counted in our core analysis.
Importantly, while the President alone is responsible for his campaign agenda, legislation he ultimately signs is drafted and approved by Congress. Prior to the current crisis, Congress passed $4 trillion of deficit-increasing tax cuts and spending increases into law, roughly half on a broad bipartisan basis. Executive orders actually reduced deficits by about $100 billion.
Details of the President’s Record and Agenda
Though the overall fiscal impact of the President’s record is relatively similar to what we estimated it would be during the campaign, the details differ substantially.
Below we compare the campaign policies and actual actions by budget area.
| Reduce and Reform Income Taxes | Campaign | Actual |
| $4.5 trillion | $2.3 trillion |
During the campaign, candidate Trump proposed a series of tax cuts and reforms that we estimated would cost $4.5 trillion through 2026. In terms of tax cuts, he proposed to reduce individual income rates to 12, 25, and 33 percent, repeal the Alternative Minimum Tax (AMT), double the standard deduction, reduce businesses taxes – including by cutting the corporate rate to 15 percent -- eliminate the estate tax, and expand tax breaks for caregiving. He called for partially offsetting these cuts by capping itemized deductions, eliminate the personal and dependent exemptions, and reducing or repealing other tax breaks.
Actual tax cuts signed into law by the President have cost $2.3 trillion by our estimates, about half as much as we estimated his campaign agenda would cost. The vast majority of this cost comes from the 2017 Tax Cuts and Jobs Act, which added $2.2 trillion to the deficit when excluding the repeal of the ACA’s individual mandate, which we account for in health care1. The lower cost is attributed mainly to the fact that actual tax cuts were somewhat more modest than proposed – the top rate was reduced to 37 percent rather than 33 percent, the corporate rate was cut to 21 percent rather than 15 percent, the AMT and estate tax were reduced rather than repealed, and the law did not include an expansion of caregiving tax breaks.
The $2.2 trillion figure excludes interest costs and savings from macroeconomic effects and excludes savings from repealing the ACA’s individual mandate, which is counted in health care. Including all these factors, CBO has estimated the TCJA would add $1.9 trillion to the debt through 2026.
| Reduce Health Care Taxes and Spending | Campaign | Actual |
| $50 billion | $150 billion |
During the 2016 campaign, candidate Trump proposed fully repealing the Affordable Care Act’s spending and taxes, expanding health insurance-related tax breaks, block granting Medicaid, allowing the purchase of health insurance across state lines, and reducing prescription drug costs. On net, we estimated these proposals would cost $50 billion through 2026 – with lower taxes slightly eclipsing lower spending.
Though the President did not repeal and replace the full ACA, he did sign into law a repeal of the penalty for the legislation’s individual mandate (which saves money by reducing health care program enrollment) and a repeal of three major taxes enacted under the ACA. Through executive action, the President also discontinued direct payments to insurers to cover the ACA’s cost-sharing reductions and expanded the use of short-term health plans and Health Reimbursement Accounts (HRAs). Some of these changes added to the deficit while others reduced it. In combination with modest Medicare savings enacted under various budget deals, we estimate these measures increased deficits by about $150 billion through 2026 on net.
| Expand Military and Veterans Spending | Campaign | Actual |
| $950 billion | $950 billion |
During the 2016 campaign, candidate Trump proposed increasing military and veterans spending by an estimated $950 billion. More specifically, Trump proposed to “rebuild the military” and finance the costs primarily by repealing the $55 billion per year “sequester” on the defense discretionary budget. In addition, he proposed to reform and increase spending on veterans, primarily by paying for veterans to use private doctors and hospitals rather than only the VA health system. We estimated these policies would cost $450 and $500 billion, respectively.
Since taking office, President Trump has signed legislation costing $950 billion over a decade, though these increases are much more concentrated in defense than veterans spending. The Bipartisan Budget Acts of 2018 and 2019 increased defense spending by $800 billion through 2026 by repealing the defense sequester and further increasing spending above that for 2018 through 2021 (beyond 2021, the baseline assumes spending will grow with inflation). Those bills also increased the non-defense discretionary budget, allowing for further appropriations to the VA. In combination with a new VA community care program that allows veterans to see private doctors in more limited circumstances, these increases added $150 billion to veterans spending through 2026.
| Adjust Non-Defense Discretionary Spending | Campaign | Actual |
| -$750 billion | $700 billion |
During the campaign, candidate Trump proposed cutting non-defense discretionary spending by $750 billion relative to CBO’s baseline. While spending was assumed to grow with inflation by roughly 2 percent per year, Trump’s proposal would instead shrink non-defense discretionary spending by 1 percent per year. If enacted, that policy would have reduced projected NDD spending by roughly a quarter in 2026.
Though the President proposed NDD cuts in each of his budgets, legislation he signed into law increased NDD spending, along with defense spending. The Bipartisan Budget Act of 2018 increased NDD spending by 16 percent between 2017 and 2019. The Bipartisan Budget Act of 2019 increased it another 4 percent by 2021. By 2026, NDD spending is projected to be 14 percent higher than what was projected when Trump was running for office. Excluding the increases for veterans, this will cost about $700 billion – rather than save $750 billion – between 2017 and 2026.
| Other Changes | Campaign | Actual |
| -$150 billion | -$250 billion |
Other changes candidate Trump proposed during the campaign would have generated about $150 billion of net deficit reduction. These changes included $250 billion of spending cuts from reducing the size of the federal workforce, cutting unauthorized appropriations by 5 percent, and reducing improper payments. Partially offsetting these cuts by $100 billion was a partially-paid maternity leave policy and Trump’s immigration policies.
Actual actions have reduced deficits by $250 billion, driven by new revenue from tariffs President Trump has imposed on China and other countries through executive action. The president has signed into law or administered a number of additional policies, but their effects are relatively small and mostly offsetting.
| Enact COVID-19 Relief (excluded from analysis) | Campaign | Actual |
| $0 | $2.7 trillion |
Our analysis excludes measures enacted in response to the current pandemic and economic crisis, which were unforeseen back in 2016 and have had near-unanimous support in Congress thus far. In total, we estimate the President has signed legislation and executive actions that will add a combined $2.7 trillion to the deficit through 2026. Major policies include the Paycheck Protection Program (PPP) to provide support for smaller businesses, direct payments to households, a significant expansion of unemployment benefits, support for the health and education sectors, aid to states, paid sick leave for certain employees affected by COVID-19, and tax relief for businesses. According to CBO, these changes will cost about $2.7 trillion through 2026. $2.6 trillion of this increase comes from three pieces of bipartisan legislation – the CARES Act, the Paycheck Protection Program and Health Care Enhancement Act, and the Families First Coronavirus Response Act (FFCRA). Executive actions and smaller pieces of legislation explain the remaining costs. We’ve been tracking these and other actions at COVIDMoneyTracker.org.
Effects of the President’s Actions on Debt
In its 2016 baseline, the Congressional Budget Office projected debt would rise from 77 percent of GDP in 2016 to 86 percent by 2026. At the time, we projected candidate Trump’s plan would increase debt to 105 percent by 2026; CBO now projects debt that year to reach 107 percent.
Of the 21-percentage point increase in 2026 debt-to-GDP projections relative to CBO’s 2016 baseline, about two-thirds is the result of pre-COVID actions signed by President Trump. In other words, the President’s pre-COVID policies alone would have increased debt-to-GDP to about 100 percent of GDP by 2026, a bit lower than the 105 percent we estimated, but well above the 86 percent projected under prior law.
The remaining 7 percent of GDP in debt not attributable to these policies is due to a 12 percentage point increase as a result of COVID relief measures, partially offset by a 5 point net reduction as a result of economic and technical revisions. These downward revisions are driven in part by lower-than-expected inflation and interest rates, including as a result of the current recession.
These figures are based on CBO’s current law baseline. They do not account for policies supported by the President that have not been enacted into law. For example, CBO previously estimated the proposals in the President’s FY2021 budget would reduce total debt by $1.1 trillion by 2026. Applying this debt reduction to CBO’s current baseline would reduce projected debt from 107 percent of GDP to 103 percent. Before the 2020 election, our US Budget Watch project will estimate the effects of the President’s current campaign agenda on projected debt levels.
Conclusion
During the 2016 campaign, we estimated that President Trump’s policies would increase debt by $4.6 trillion over ten years, excluding interest. Actual legislation and executive actions during the Trump administration prior to the current crisis increased deficits through 2026 by $3.9 trillion.
While debt was already projected to rise before these actions – from 77 percent of GDP in 2016 to 86 percent by 2026 – it is now projected to rise much higher. We estimate that the $3.9 trillion of actions signed by the President before the COVID crisis would have lifted debt to about the size of the economy by 2026.
Adding in the effects of the current crisis and response, CBO projects debt will reach a 107 percent of GDP in 2026, the largest level of debt in our nation’s history.
1 The $2.2 trillion figure excludes interest costs and savings from macroeconomic effects and excludes savings from repealing the ACA’s individual mandate, which is counted in health care. Including all these factors, CBO has estimated the TCJA would add $1.9 trillion to the debt through 2026.