Choices for Financing Medicare for All
Proposals to adopt a single-payer health care system – commonly called Medicare for All – have become increasingly popular. Such proposals, which offer universal coverage of virtually all medical services with no meaningful premiums or cost sharing, would shift nearly all private health spending to the public sector and thus significantly increase federal spending. Choices for financing these costs would have considerable distributional, economic, and policy implications.
In 2019, the Committee for a Responsible Federal Budget released a preliminary analysis of Choices for Financing Medicare for All. In this update, we show that:
- Medicare for All is likely to increase federal costs by between $25 trillion and $35 trillion over ten years, depending both on estimating assumptions and on important design choices and policy details.
- To finance $30 trillion – a rough midpoint – policymakers would likely adopt a combination of approaches that are equivalent to a 32 percent payroll tax, 25 percent income surtax, 42 percent value-added tax (VAT), a $7,500 per capita mandatory public premium, doubling all income tax rates, reducing non-health spending by 80 percent, or increasing debt 105 percent of GDP. Taxes on high earners and corporations alone could not finance Medicare for All.
- Each financing option would have different economic effects. An analysis from Penn Wharton Budget Model finds that payroll tax financing Medicare for All would reduce GDP by 7.3 percent in 2030, deficit financing it would reduce GDP by 5.9 percent, and premium financing would reduce GDP by 2.3 percent. Those options would reduce hours worked by 12, 10, and 7 percent, respectively – the equivalent of 17 million, 14 million, and 10 million jobs.
- Most financing options would be more progressive than new spending but have different distributional implications within and between income groups. Doubling income tax rates would be the most progressive, followed by an income tax surtax, followed by a payroll tax or a VAT. A mandatory public premium could be modestly regressive relative to the additional spending.
- Significant increases in tax rates from these options could lift the top rate to near or above the revenue-maximizing level, leaving little capacity to raise future revenue for other important purposes.
- Financing Medicare for All with a combination of policies – the most likely outcome – could balance these consequences but not necessarily reduce them.
Policymakers should carefully consider and weigh the relative costs and benefits of these consequences in deciding how much to expand federal health spending and how to finance the costs associated with doing so.
The Budgetary Cost of Medicare for All
The term Medicare for All has come to represent proposals that offer universal, single-payer health insurance coverage for virtually all health care services (including dental, vision, and long-term care) with no meaningful premiums, deductibles, copayments, or restrictive networks. Medicare for All, somewhat confusingly, is not generally used to describe the expansion of the current Medicare program to all Americans, and our analysis does not analyze this type of policy.
In theory, Medicare for All could increase or decrease national health expenditures, which is the total amount spent on health care by all private and public sources. Cost increases would come from covering those who are currently uninsured; expanding coverage to include services like dental, vision, and long-term care; and eliminating deductibles and copayments that currently help curb utilization. Cost reductions would come from lower administrative costs and significantly lower payments to medical providers and drug manufacturers.1
Regardless of the impact on total national health expenditures, Medicare for All would shift virtually all private health costs to the federal government. In combination with eliminating all premiums and cost sharing, this alone could cost the federal government $2 trillion per year.
A number of experts and modelers have attempted to quantify the exact federal cost of Medicare for All. Based on these studies, which we adjusted to remove revenue effects and measures over the same budget window, we believe Medicare for All is likely to require between $25 trillion and $35 trillion of additional federal financing over the next decade.
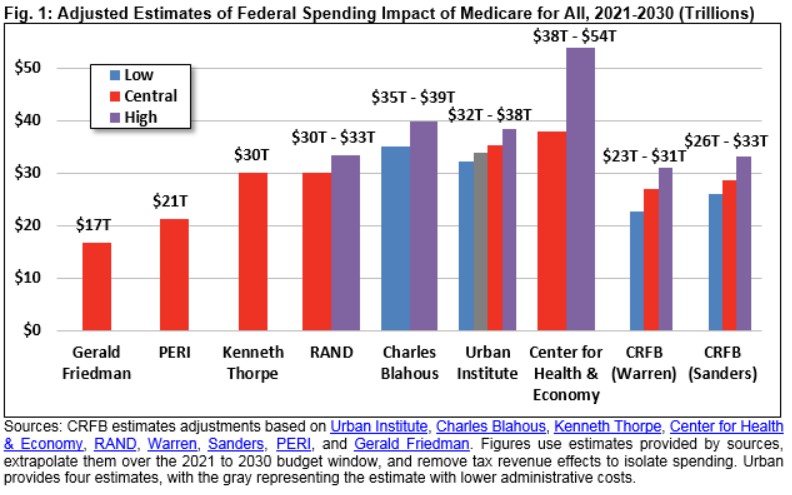
To determine the potential cost of Medicare for All, we first examined estimates published by the Urban Institute, Charles Blahous, Kenneth Thorpe, the Center for Health & Economy, the RAND Corporation, the Political Economy Research Institute (PERI) at the University of Massachusetts at Amherst, and Gerald Friedman. Some of these studies are more rigorous than others, and each made different assumptions regarding provider payment rates, administrative costs, drug prices, utilization effects, state contributions (or lack thereof), and availability of long-term care benefits.
Recognizing these differences, our analysis attempts to improve the comparability of these estimates by removing revenue feedback and extrapolating all to the 2021 to 2030 budget window. Incorporating these adjustments, the lowest cost estimate we identified was $17 trillion of net spending increases from Gerald Friedman of the University of Massachusetts at Amherst in 2016. The highest estimate we identified was $54 trillion from the Center for Health & Economy at the American Action Forum. Most estimates range from $30 trillion to $40 trillion of new spending. Estimates from scholars at the Urban Institute range from $32 trillion to $38 trillion.
Importantly, the cost of Medicare for All depends not only on estimating assumptions, but also discrete policy choices. For example, Senator Bernie Sanders (I-VT) has proposed to limit prescription drug costs to an international index.2 Senator Elizabeth Warren (D-MA) proposed a similar but slightly higher limit, coupled with reductions and reforms to provider payments.3 We recently estimated these proposals would likely cost $29 trillion and $27 trillion, respectively, with a range of $23 trillion to $33 trillion under our low- and high-cost estimates.
Incorporating revenue feedback would lower all of these figures. Under Medicare for All, employers would no longer provide tax-preferred health insurance benefits and instead would pay more in taxable wages. Scholars at the Urban Institute estimate these higher wages could increase income tax revenue alone by over $2 trillion over a decade.
On net, Medicare for All is likely to require roughly $25 trillion to $35 trillion of additional financing through 2030 on top of this feedback. How this cost is financed is an extremely important and consequential question.
Options for Financing Medicare for All
Though most of the federal cost of Medicare for All would come from replacing private spending with public spending, these costs would nonetheless need to be financed through higher taxes, lower spending, more borrowing, or some combination of the three.
As a practical matter, a plan to finance Medicare for All would likely rely on a combination of policies – as has been proposed by the Presidential candidates who currently support Medicare for All.4 To understand the magnitude of and trade-offs associated with these policies, however, it is helpful to consider the necessary size of each choice in isolation.
For estimating purposes, we assume Medicare for All will cost $30 trillion and also offer estimates assuming costs as low as $25 trillion and as high as $35 trillion. Based on these assumptions, we estimate that policymakers could finance a Medicare for All plan over the next decade in any of the following ways:5
- Impose a 32 percent payroll tax. Currently, most wage income is subject to a 15.3 percent payroll tax divided evenly between workers and employers to fund Social Security and Medicare. Wages above $138,000 are subject to either a 2.9 percent or 3.8 percent payroll tax to fund Medicare. We estimate a new 32 percent payroll tax, divided evenly between workers and employers and applied to all wages, would raise roughly $30 trillion over a decade. An equivalent amount of revenue could be raised with a 23 percent payroll tax on the employee side only or a 48 percent tax on the employer side.6,7 Under different cost assumptions, the payroll tax rate could be as low as 26 percent and as high as 39 percent, split evenly between employers and employees.
- Establish a 25 percent income surtax on adjusted gross income (AGI) above the standard deduction. Under current law, households pay taxes on their income under a progressive rate structure that ranges from 10 percent to 37 percent, with preferential rates for long-term capital gains and qualified dividends as well as deductions for mortgage interest, charitable giving, state and local taxes up to $10,000, pass-through business income, and other purposes. There is also a standard deduction of $12,400 for individuals and $24,800 for married couples. We estimate a 25 percent of AGI income surtax above the standard deduction would raise roughly $30 trillion over a decade.8,9 This surtax would effectively increase the bottom income tax rate from 10 percent to 35 percent, the top income tax rate from 37 percent to 62 percent, and the top ordinary capital gains and dividends rate from 20 percent to 45 percent. Under different cost assumptions, the necessary income surtax could be as low as 20 percent and as high as 30 percent.
- Enact a 42 percent value-added tax (VAT). Whereas most developed countries raise a substantial share of their revenue through a tax on consumption – known as a VAT – the United States only taxes consumption broadly through state and local sales taxes. A VAT could be introduced at the federal level to finance Medicare for All. Based on estimates from the Congressional Budget Office (CBO), we project a broad-based VAT of 42 percent would raise about $30 trillion over a decade. The first-order effect of this VAT would be to increase the prices of most goods and services by 42 percent; the VAT would thus represent 30 percent of costs on a tax-inclusive basis, which is more comparable to an equivalent income or payroll tax rate increase. Under different cost assumptions, the necessary VAT could be as low as 35 percent and as high as 49 percent. Importantly, a VAT can be designed in different ways, which could change the required tax rate.
- Require a mandatory public premium averaging $7,500 per capita – the equivalent of $12,000 per individual not otherwise on public insurance. Currently, most Americans are charged health insurance premiums – the majority of which are paid by employers on their behalf. Though current Medicare for All proposals call for ending premiums, policymakers could consider financing Medicare for All through mandatory fixed-dollar payments to the federal government. These payments would be a form of a head tax but could resemble premiums in a number of ways. For example, they could vary based on household size and could be paid in part or in whole by employers.10 They could also be reduced or waived for some individuals, perhaps based on income. In 2021, we estimate those premiums would need to average about $7,500 per capita or $20,000 per household (including single-person households) if applied to all individuals, including retirees, children, and low-income individuals. Fully exempting everyone who would otherwise be on Medicare, Medicaid, or CHIP would increase the premiums by over 60 percent to more than $12,000 per individual. Under different cost assumptions, the necessary premium would be as low as $6,000 per capita or as high as $9,000.
- More than double all individual and corporate income tax rates. Under current law, ordinary income is taxed under a progressive rate structure with a bottom rate of 10 percent and a top rate of 37 percent, while long-term capital gains and qualified dividends are taxed at a top rate of 20 percent (plus a 3.8 percent surtax) and corporate income at a rate of 21 percent. Assuming capital gains are taxed at death and pass-through income is no longer deductible,11 we estimate that doubling all individual income tax rates would raise $20 trillion to $25 trillion over a decade, and doubling the corporate rate would raise about $2 trillion. Some additional revenue would be needed on top of these increases to reach $30 trillion in total revenue. This option differs from the income surtax in a number of ways, especially because it would represent a much smaller tax increase for lower- and middle-income taxpayers. Under this scenario, the bottom ordinary income tax rate would be raised to 20 percent, the top ordinary rate would be 74 percent, capital gains would be taxed at a top rate of 40 percent, and the corporate tax rate would be 42 percent.
- Reduce non-health federal spending by 80 percent. The federal government is projected to spend $61 trillion over the next decade, including $17 trillion on health care and $6 trillion on interest costs. We estimate that financing the full cost of Medicare for All with spending cuts would require cutting the remaining federal budget by 80 percent.12 Cuts of this magnitude are unrealistically large and certainly could not be imposed on a short timeline. For illustrative purposes, an 80 percent cut to Social Security would mean reducing the average new benefit from about $18,000 per year to $3,600 per year, and an 80 percent cut to the military would mean, among other things, reducing the number of soldiers and officers from 1.3 million today to 270,000. Under different cost assumptions, necessary spending cuts could be as low as 65 percent or as high as 95 percent.
- More than double the national debt to 203 percent of the economy. Federal debt held by the public currently totals about $17 trillion, or 80 percent of GDP. Under current law, debt is projected to reach 98 percent of GDP by 2030. Assuming no changes in projected interest rates or economic growth, deficit-financing Medicare for All over the next decade would require nearly $34 trillion of new borrowing including interest, which is the equivalent of 105 percent of GDP by 2030. As a result, debt would rise to 203 percent of GDP, more than double its currently projected level. This would put debt in 2030 at almost five times its historic average of 42 percent and nearly twice the historic record of 106 percent (set after World War II). Under different cost assumptions, debt could rise by as little as 89 percent of GDP and as much as 124 percent of GDP. Debt would continue to grow rapidly beyond 2030.
- Impose impossibly high taxes on high earners, corporations, and the financial sector. There is not enough annual income available among higher earners to finance the full cost of Medicare for All. On a static basis, even increasing the top two income tax rates (applying to individuals making over $207,000 per year and couples making over $414,000 per year) to 100 percent would not raise $30 trillion over a decade. In reality, a tax increase that large would actually lose revenue because it would institute marginal tax rates above 100 percent when other taxes are incorporated – effectively requiring people to pay rather than be paid to work, earn business income, or sell capital assets. We previously found that an extremely aggressive package of tax hikes on high earners, corporations, and the financial sector might cover 35 percent of the $30 trillion cost of Medicare for All (or 31 to 44 percent under different cost estimates). Our very rough estimates showed that over the next decade raising the top two individual and pass-through rates to 70 percent would raise about $2 trillion, phasing out most tax breaks for higher earners (assuming that 70 percent top rate) could very generously raise another $2 trillion, and doubling the corporate tax rate would raise $2 trillion. We also found that a wealth tax or “mark-to-market” capital gains taxation could raise $3 trillion, and the combination of a financial transaction tax and a tax on large financial institutions could raise about $1 trillion. Other taxes on high earners and the wealthy could raise some additional funds.
- Enact a combination of approaches. Rather than identify a single revenue source to finance Medicare for All, policymakers could combine several options. For example, one could combine a 16 percent employer-side payroll tax with a public premium averaging $3,000 per capita, $5 trillion of taxes on high earners and corporations, and $1 trillion of spending cuts. Other small options, such as higher excise taxes on alcohol, tobacco, or sugary drinks, could also be included, as could policies to require or encourage state governments to contribute to offsetting the cost of Medicare for All. Adopting smaller versions of several policies may prove more viable than adopting any one policy in full.
While the financing options above are quite large in magnitude, their sizes shrink under cheaper versions of Medicare for All.
The low end of our cost range effectively assumes aggressive efforts to reduce provider and prescription drug costs, but theoretically further efforts could be undertaken. Our Budget Offsets Bank incudes numerous options to reduce the cost of traditional Medicare; some of these options would save much more if applied to a comprehensive Medicare for All program (see Senator Warren’s Medicare for All plan, for example).
Cost reductions could also be achieved by scaling back the generosity of a Medicare for All program. For example, the Urban Institute recently estimated that a Medicare for All plan that required cost sharing to cover between 5 and 20 percent of medical costs (depending on income) and covered only core health benefits (not vision, dental, hearing, or long-term care) would cost the federal government half as much per person as a comprehensive Medicare for All plan. Similarly, Penn Wharton Budget Model’s estimates imply that expanding the current Medicare program to everyone would cost about two-thirds as much as the type of Medicare for All plan we have analyzed here.
Removing coverage of non-core benefits (especially long-term care), enacting aggressive payment reduction measures, and establishing deductibles and coinsurance could theoretically reduce the net federal cost of Medicare for All to as low as $13 trillion. Financing a $13 trillion program would require a 13 percent payroll tax, for example, compared to the 32 percent payroll tax required to fund $30 trillion and 39 percent required to fund $35 trillion.
The Economic Impact of Financing Choices
Deciding how to finance Medicare for All involves weighing significant trade-offs amongst options as well as relative to the current system and may have as much distributional, economic, and policy importance as the choice over whether to adopt Medicare for All itself.
The majority of Americans pay for their health care through premiums (especially employer-paid premiums), deductibles, and copayments. These payments do not generally rise with income and thus have little effect on the marginal incentive to work or invest. Alternative financing, depending on the details, could reduce the size of the economy relative to the current system.13
Recently, Penn Wharton Budget Model (PWBM) estimated the impact of several options to finance a version of Medicare for All.14 These estimates reflect the impact in the steady state and not during a recession or over the course of a transition. PWBM found that universal health care itself would grow the economy through a healthier and more productive workforce, longer lifespans, and higher wages. However, the analysis found that options to finance Medicare for All would reduce the incentive to work, save, and invest and reduce economic output.
Raising payroll taxes to finance expanded Medicare, PWBM estimates, would reduce projected GDP by 7.3 percent in 2030 – the equivalent of about $6,500 per person. It would reduce hours worked by 12.2 percent – the equivalent of 17 million full-time equivalent (FTE) jobs. In other words, this tax would cause many Americans to reduce hours worked or leave the labor force.
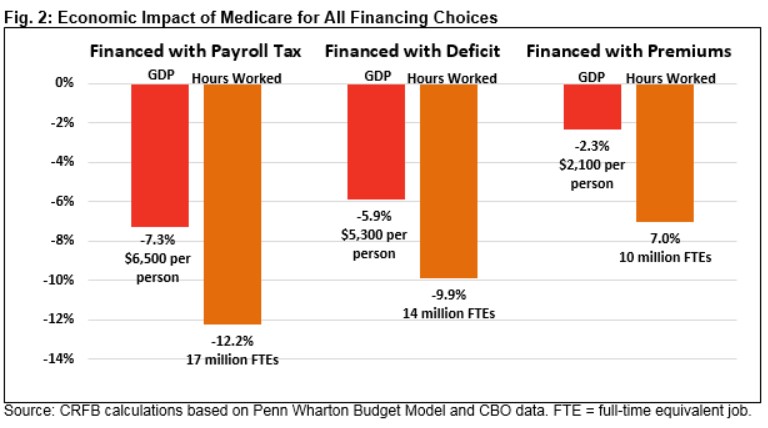
Deficit financing Medicare for All would also harm the economy, mainly by crowding out investment in productive capital. PWBM finds it would reduce projected GDP by 5.9 percent in 2030 – the equivalent of about $5,300 per person – and gross national product would likely fall by significantly more. PWBM also finds that deficit financing Medicare for All would reduce hours worked by nearly 10 percent – the equivalent of 14 million full-time equivalent jobs.
Lastly, PWBM estimates that charging mandatory premiums, while subsidizing low-income beneficiaries, would reduce GDP by 2.3 percent – the equivalent of $2,100 per person. It would reduce hours worked by 7 percent – the equivalent of 10 million full-time equivalent jobs.
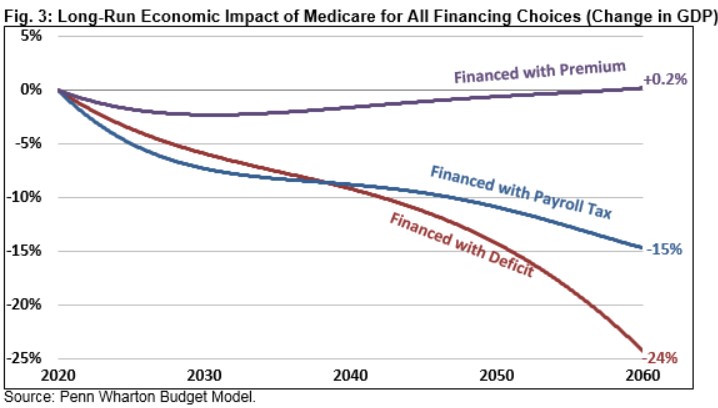
Over the long run, PWBM estimates the effects of a payroll tax and especially deficit financing would become more pronounced. By 2060, raising payroll taxes to finance Medicare for All would reduce projected GDP by 15 percent, while deficit financing Medicare for All would reduce GDP by 24 percent. Premium-financed Medicare for All, on the other hand, would have virtually no impact on long-run GDP; beyond 2060, it might even improve the economy.
While PWBM has not estimated the economic impact of other financing options, most would likely reduce GDP relative to current projections. Financing Medicare for All with a VAT would likely shrink the economy by less than the payroll tax, while financing it with an income surtax is likely to reduce GDP more, and financing it by doubling all individual and corporate tax rates is likely to have an even larger negative effect.
Importantly, different cost assumptions under the PWBM model would yield different results from the ones presented here, particularly over the long run.15 PWBM also finds that financing an expanded traditional Medicare program – which, unlike Medicare for All, would include some premiums and cost sharing – would have a much smaller economic impact. PWBM estimates that financing expanded traditional Medicare with a payroll tax would reduce GDP by 5.3 percent in 2030, deficit financing it would reduce GDP by 4.4 percent, and financing it entirely with premiums would actually increase GDP by 1 percent.16
The Distributional Impact of Financing Choices
Different choices for financing Medicare for All would have different distributional implications. While any financing choice will create a significant number of winners and losers relative to current law, most of the options we consider in this paper would result in more progressivity – on average – than under current law.
There are at least two ways to measure the progressivity of Medicare for All itself. One is to consider the extent to which Medicare for All will reduce current premiums and out-of-pocket medical expenditures. An alternative is to consider the distribution of new spending under the Medicare for All program. For purposes of this analysis, we use the latter approach. This approach has the advantage of counting new health benefits as an improvement in income but the disadvantage of counting higher costs (including higher provider and drug prices) as an improvement in income – even if those costs are not associated with more or better health care.
Using this measure based on a 2016 Urban Institute study, Medicare for All itself would increase transfer payments to all income groups but more for individuals higher up the income ladder. Those in the middle of the income distribution would receive a benefit almost 50 percent higher than those at the bottom, while those in the top quintile would receive a benefit nearly twice as high. This is likely driven by the fact that many of those lower on the income spectrum already have access to taxpayer-financed or subsidized health coverage.
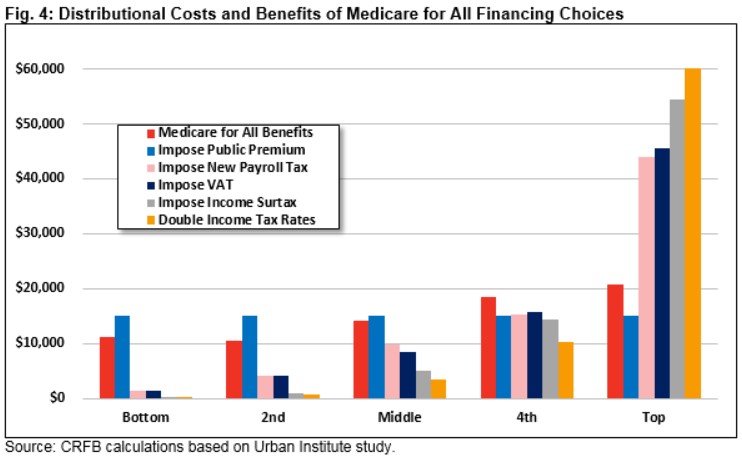
To best compare these benefits to various financing choices, we calibrated all options to raise taxes by exactly $15,000 per household (and Medicare for All to spend $15,000 per household) per year. Because we used a variety of sources with slightly different measures of income, these figures are not purely apples-to-apples but are roughly comparable.17
The least progressive option we considered to finance Medicare for All is the per-capita premium. Assuming this premium is applied to every household regardless of income or employment status, it would tax households in every quintile by $15,000 per year.18 This would be more regressive than Medicare for All benefits – though adjustments to the design of the premiums (for example, capping them relative to income) could shift this distribution.
Other tax options we considered would all be progressive relative to Medicare for All’s costs, at least on average. Payroll tax and VAT increases would both increase revenue relatively proportional to income. They would each require less than $1,500 of average tax payments from those in the bottom quintile, less than $10,000 for those in the middle, and over $40,000 for those at the top.19
The income surtax would be significantly more progressive, as it would exempt most low-income households and would also apply to capital gains and dividends. We estimate it would increase average taxes in the bottom quintile by about $150, increase them in the middle by $5,000, and increase them at the top by $55,000.
Roughly doubling all individual and corporate tax rates is the most progressive option we analyzed; this option would increase taxes in the middle quintile by $3,500 and increase them at the top by $60,000.
Though most of the options we considered would increase progressivity overall, they would each create winners and losers within each income bracket. Moreover, many households who would appear better off under this analysis from receiving larger transfer payments would nonetheless be paying more than under current law. For example, someone who is currently uninsured or on Medicaid would end up paying much more with a payroll tax or VAT than they do today, but our analysis might imply that they are better off since spending on their health care would go up.
Importantly, a financing approach that combines options could yield progressive results even with regressive elements. For example, financing half of Medicare for All with a public premium and half with an income surtax would leave the bottom four quintiles roughly $3,500 better off while increasing taxes by $14,000 more than benefits for the average household in the top quintile.
The Impact of Financing Choices on Tax Capacity
An additional consideration is how much capacity any of these financing options might leave for future policymakers aiming to raise revenue to pay for new programs, fund existing ones, or reduce deficits. While new taxes would largely replace existing premiums and out-of-pocket costs, most of the taxes we considered (other than the public premium) would increase marginal tax rates – discouraging work and investment and encouraging avoidance and evasion.
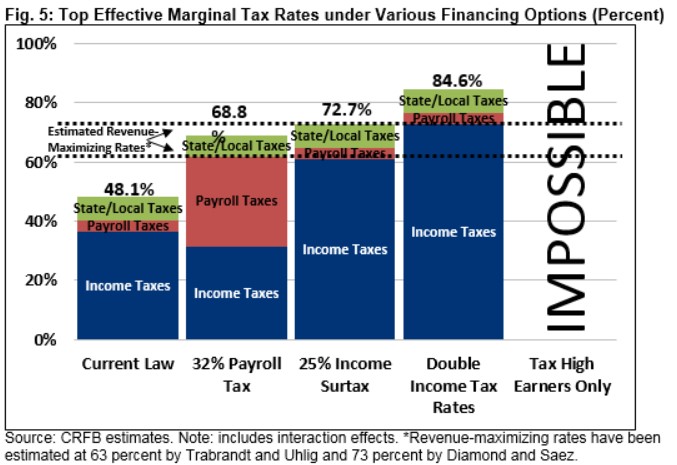
While higher tax rates generally increase revenue, it is widely understood that at some point the rate becomes so high that it stops raising revenue. Economic literature suggests a revenue-maximizing tax rate of between 63 percent and 73 percent for ordinary income (and lower for capital gains),20 after which further rate increases actually lose revenue. As tax rates approach these high levels, they would reduce the ability of policymakers to raise revenue in the future.
Under current law, the top effective marginal tax rate (accounting for state and local taxes in a typical state) is about 48 percent. That rate would rise to 69 percent with a 32 percent payroll tax hike (the increase is smaller than the tax due to interactions with the tax base), 73 percent under a 25 percent income surtax, and 85 percent if income tax rates were doubled. In other words, each of these options would bring the top rate close to or above the revenue-maximizing rate. This would make it very difficult to raise further revenue for other public purposes.
Financing Medicare for all with spending cuts or debt would lead to similar issues – leaving little room to cut or borrow for other purposes.21 Of the options considered in this paper, only public premiums would avoid this capacity issue, since they have no effect on marginal tax rates.
Conclusion
Regardless of its impact on national health expenditures, Medicare for All would shift substantial costs from the private sector to the federal government. By most estimates, a comprehensive Medicare for All plan that expands coverage to every U.S. resident for nearly all medical services and eliminates premiums and cost sharing would require the federal government to identify between $25 trillion and $35 trillion of financing.
Policymakers have a number of options available to finance the cost of Medicare for All. We estimate a $30 trillion cost could be covered with a 32 percent payroll tax, a 25 percent income surtax, a 42 percent value-added tax, or a public premium averaging $7,500 per capita. Medicare for All could also be paid for by more than doubling individual and corporate income tax rates, reducing federal spending by 80 percent, or increasing the national debt by 105 percent of GDP. Tax increases on high earners, corporations, and the financial sector by themselves could not cover much more than one-third of the cost of Medicare for All.
Each of these options would come with its own set of trade-offs. Most would increase progressivity relative to current law but by different amounts. Most options would also lead to lower levels of GDP by 2030: Penn Wharton Budget Model estimates payroll tax financing would reduce the size of the economy by 7 percent, deficit financing would reduce it by 6 percent, and premium financing would reduce it by 2 percent. Finally, most of the options would reduce the federal government’s ability to raise revenue, borrow, or cut spending for other purposes.
Policymakers must weigh these trade-offs against each other and against the benefits that come with providing a universal Medicare for All benefit.
Of course, rather than adopting any one of the financing choices above, policymakers could and likely would consider a combination of approaches. Doing so would allow policymakers to balance the consequences associated with various choices. Policymakers could also reduce the needed financing by reducing the cost, scope, or generosity of Medicare for All.
Regardless of the federal cost, policymakers must consider the distributional, economic, and policy consequences of replacing premiums and cost sharing with various alternatives.
1 While theoretically ambiguous, Medicare for All that offers a new universal long-term care benefit is much more likely to increase national health expenditures (NHE) than reduce them in our assessment. For example, we recently found that Senator Bernie Sanders’s (I-VT) Medicare for All proposal – assuming Medicare rates for providers, drug prices at their international average, and administrative costs of 4.5 percent – would increase NHE by 6 percent. Under Senator Elizabeth Warren’s (D-MA) plan, which also imposes aggressive reductions to provider payments, we estimated NHE would increase by 3 percent. See Committee for a Responsible Federal Budget, “How Will Candidate Plans Affect Total Health Costs?”, March 2020, https://www.crfb.org/blogs/how-will-candidate-plans-affect-total-health-costs.
2 For a full description of Senator Sanders’s health plan, see Committee for a Responsible Federal Budget, “Primary Care: Estimating Leading Democratic Candidates’ Health Plans,” January 2020, https://www.crfb.org/papers/primary-care-estimating-leading-democratic-candidates-health-plans#Sanders.
3 For a full description of Senator Warren’s health plan, see Committee for a Responsible Federal Budget, “Primary Care: Estimating Leading Democratic Candidates’ Health Plans,” January 2020, https://www.crfb.org/papers/primary-care-estimating-leading-democratic-candidates-health-plans#Warren.
4 See Committee for a Responsible Federal Budget, “Primary Care: Estimating Leading Democratic Candidates’ Health Plans,” January 2020, https://www.crfb.org/papers/primary-care-estimating-leading-democratic-candidates-health-plans.
5 These figures represent rough estimates generated by the Committee for a Responsible Federal Budget using our own models as well as a variety of sources, including the Open Source Policy Center’s Tax-Brain, the Congressional Budget Office, the Joint Committee on Taxation, the Centers for Medicare and Medicaid Services, and the Tax Policy Center. Estimates are from 2021 to 2030, exclude any macroeconomic effects, and include only modest behavioral effects. All estimates assume that the elimination of private health insurance premiums would lead to a significant increase in taxable wages.
6 An employer-side payroll tax raises significantly less than an employee-side tax because higher employer contributions lead them to pay lower taxable wages. The result is lower revenue from current income and payroll taxes as well as from the newly imposed payroll tax itself.
7 Senator Sanders proposes a form of employer payroll tax to help finance Medicare for All. Under his plan, employers would pay 7.5 percent of wage income; however, the first $2 million of payroll would be exempt for each employer. This exemption significantly reduces revenue generation. See Committee for a Responsible Federal Budget, “Primary Care: Estimating Leading Democratic Candidates’ Health Plans,” January 2020, https://www.crfb.org/papers/primary-care-estimating-leading-democratic-candidates-health-plans#Sanders.
8 As part of this policy, we also assume all capital gains would be taxed at death and with this surtax. Absent that assumption, capital gains revenue would significantly decline under this surtax.
9 Senator Sanders proposes a form of an income surtax to help finance Medicare for All. Under his plan, workers would pay a 4 percent income surtax on income above $29,000 for a family of four. See Committee for a Responsible Federal Budget, “Primary Care: Estimating Leading Democratic Candidates’ Health Plans,” January 2020, https://www.crfb.org/papers/primary-care-estimating-leading-democratic-candidates-health-plans#Sanders.
10 Senator Warren proposes a form of mandatory employer-paid premium to help finance Medicare for All. Under her plan, employers would generally pay a contribution based on what they paid for health premiums prior to Medicare for All, and over time that contribution would transition to a fixed-dollar payment based on total health expenditures. See Committee for a Responsible Federal Budget, “Primary Care: Estimating Leading Democratic Candidates’ Health Plans,” January 2020, https://www.crfb.org/papers/primary-care-estimating-leading-democratic-candidates-health-plans#Warren.
11 Allowing households to deduct 20 percent of business income and step up the basis of assets held at death would require much higher rates and would likely result in substantial tax avoidance. We therefore assume any reasonable policy to increase tax rates so dramatically would close off these and other avoidance techniques that could lead to large revenue losses.
12 The replacement of Medicare, Medicaid, and most other federal health spending is already assumed in cost estimates of Medicare for All. If the cost of the new Medicare for All program were cut proportionally with the rest of the budget, the total size of the cut would fall to 45 percent.
13 Though premiums are not taxes, they have many features in common with an economically efficient (though regressive) ‘head tax.’
14 PWBM modeled a version of Medicare for All that it believes most closely resembles Senator Sanders’s Medicare for All Act mechanism. PWBM calibrates its model by first estimating the effects of expanding traditional Medicare to include a larger population and more services (notably, dental and long-term services and supports) before analyzing the budgetary effects of eliminating private health insurance, premiums, and cost sharing. Because the legislation does not include specific financing, PWBM does not model any of Senator Sanders’s options to finance the program; instead, it models three broader financing options. For this reason, the comparison should be seen as illustrative rather than a projection. For more on the PWBM analysis, see Penn Wharton Budget Model, “Senator Sanders’ Medicare for All (S.1129): An Integrated Analysis,” January 2020, https://budgetmodel.wharton.upenn.edu/issues/2020/1/30/sanders-medicare-for-all.
15 Under different cost assumptions, all three financing mechanisms could have smaller or larger effects. Using PWBM’s lowest possible cost assumptions – which, likely impossibly, assume the initial drop in health expenditures under Medicare for All equals 16 percent, the long-term care program does not lead to any increase in home and community-based services, and overhead costs are limited to 1 percent – financing Medicare for All with premiums would reduce GDP by 2.3 percent by 2030, while payroll tax financing would decrease it by 7.2 percent and an increase in the deficit would decrease it by 6.4 percent. Using the highest possible cost assumptions – which assume an 8 percent drop in health expenditures, a 300 percent increase in home and community-based services, and 5 percent overhead costs – financing Medicare for All with premiums would decrease GDP by 1.3 percent by 2030 and financing it with a payroll tax would decrease GDP by 7.6 percent by 2030. The model breaks under the highest cost assumptions using deficit finance, likely because it would not be able to reach equilibrium with such high debt at any time in the foreseeable future. However, other estimates lead us to believe it could reduce GDP by as much as 10 percent by 2030. For more on the PWBM analysis, see Penn Wharton Budget Model, “Senator Sanders’ Medicare for All (S.1129): An Integrated Analysis,” January 2020, https://budgetmodel.wharton.upenn.edu/issues/2020/1/30/sanders-medicare-for-all.
16 See Penn Wharton Budget Model, “Medicare for All: Comparison of Financing Options,” January 2020, https://budgetmodel.wharton.upenn.edu/issues/2020/1/30/medicare-for-all-background.
17 We estimate the distributional impact of Medicare for All based on estimates of acute and long-term care benefits from Mermin, Burman, and Sammartino. Estimates of the individual income and payroll tax changes were generated by the Open Source Policy Center’s Tax-Brain. The value-added tax was based on figures provided by Bill Gale of the Brookings Institution. Corporate tax increase were distributed based on estimates from the Tax Policy Center. And public premiums were assumed to distribute evenly. In each case, we calibrated total revenue to equal $15,000 per tax unit on average and assumed quintiles were exactly equal in size. Because different sources have different definitions of and models for the income quintiles, these figures are not purely comparable. However, we believe they offer a helpful illustration of order of magnitude. See Gordon B. Mermin, Leonard E. Burman, and Frank Sammartino, “An Analysis of Senator Bernie Sanders’s Tax and Transfer Proposals,” Tax Policy Center, May 2016, https://www.taxpolicycenter.org/publications/analysis-senator-bernie-sanderss-tax-and-transfer-proposals; Open Source Policy Center, Tax-Brain, https://apps.ospc.org/taxbrain/; and Tax Policy Center, “T17-0180 – Share of Change in Corporate Income Tax Burden; By Expanded Cash Income Percentile, 2017,” June 2017, https://www.taxpolicycenter.org/model-estimates/distribution-change-corporate-tax-burden-june-2017/t17-0180-share-change-corporate.
18 For purposes of this option, only, we assumed household sized do not vary by income. We also assume this premium applies to everyone, including those with too little income to be able to pay the premium.
19 Based on conventional estimating methodologies, our VAT figures use a modified “source” rather than “use” method – meaning they treat the VAT as if it comes from income rather than tracking the first-order distribution of the tax as spending occurs. Under a use method, the VAT would appear less progressive or more regressive than under our figures. For more, see Eric Toder, James R. Nunns, and Joseph Rosenberg, “Methodology for Distributing a VAT,” Urban Institute, April 2011, https://www.urban.org/research/publication/methodology-distributing-vat.
20 Economists Mathias Trabandt and Harold Uhlig estimate a revenue-maximizing rate of 63 percent, while economists Peter Diamond and Emmanuel Saez estimate a revenue-maximizing rate of 73 percent.
21 For more information on the limits of financing options, see Committee for a Responsible Federal Budget, “Running on Empty? Fiscal Space and the Next Recession,” September 2016, https://www.crfb.org/papers/running-empty-fiscal-space-and-next-recession.