What CBO Says About the House Obamacare Replacement
Update (3/21/2017): These numbers are relevant for the original version of the American Health Care Act. An amended version was released on March 20.
The Congressional Budget Office (CBO) just released their initial score of the American Health Care Act (AHCA), House Republicans’ replacement to the Affordable Care Act (ACA or "Obamacare").
| Provision | 2017-2026 Cost / Savings (-) |
|---|---|
| End Mandate Penalties | $210 billion |
| Reduce Spending and Tax Subsidies | -$1.66 trillion |
| Increase Spending and Tax Subsidies | $542 billion |
| Repeal ACA Taxes | $575 billion |
| Total Deficit Impact (Conventional Scoring) | -$337 billion |
We’ll be providing more analysis of this legislation later, but among the key findings:
- The AHCA would reduce deficits by $337 billion through 2026 under conventional scoring.
- The AHCA’s $337 billion of savings is the result of a $1.66 trillion reduction in the cost of spending and tax subsidies with most of the funds used to pay for ending the mandate penalties ($210 billion), increasing spending in other areas while instituting new tax subsidies ($542 billion), and cutting taxes by $575 billion by repealing most of ACA's tax hikes.
- On net, the AHCA would reduce outlays by $1.22 trillion and revenue by $883 billion through 2026.
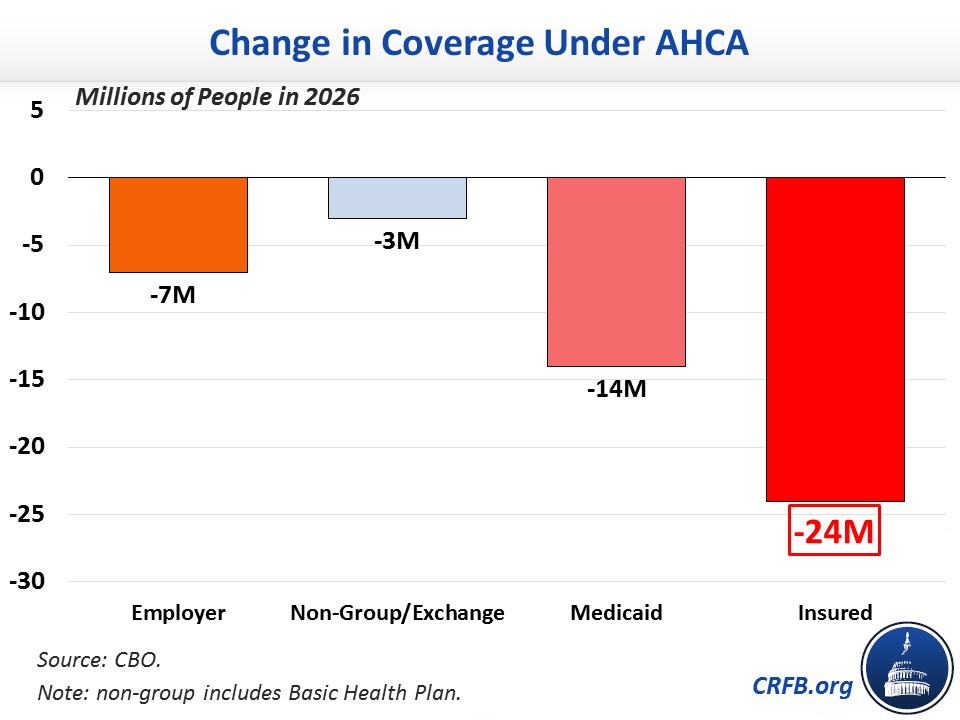
- CBO estimates the AHCA would reduce the number of Americans with health insurance by 14 million in 2018 and 24 million by 2026. The 24 million reduction is the result of 14 million fewer Medicaid beneficiaries, 7 million fewer individuals with employer coverage, and 3 million fewer in other coverage areas including the exchanges.
- CBO estimates that average market premiums would rise in the short term by 15 to 20 percent on average in 2018 and 2019 and then fall by 10 percent relative to current law by 2026.
- CBO did not have time to complete an estimate of the macroeconomic effects of this bill or a second-decade estimate, though CBO does indicate the bill would continue to reduce deficits over the long term. In our assessment, the legislation would likely produce modest increases in economic growth under CBO's model.
The table below breaks down the major elements of the CBO score:
| Provision | 2017-2026 Cost / Savings(-) |
|---|---|
| Reduce Individual Mandate Penalty to $0 | $171 billion |
| Reduce Employer Mandate Penalty to $0 | $38 billion |
| Subtotal, End Mandate Penalties | $210 billion |
| Repeal ACA Premium and Cost-Sharing Subsidies in 2020 | -$673 billion |
| Reduce ACA Medicaid Match to Base Medicaid Rate for “Expansion” Beneficiaries and Establish Per-Capita Caps | -$880 billion |
| Other Reductions | -$41 billion |
| Coverage Interactions | -$70 billion |
| Subtotal, Reduce Spending and Tax Subsidies | -$1.66 trillion |
| Establish Flat Age-Adjusted Health Care Tax Credits in 2020 | $361 billion |
| Establish Patient and State Stability Fund | $80 billion |
| Repeal Disproportionate Share Hospital Payment Cuts (Medicare & Medicaid) | $74 billion |
| Expand Health Savings Accounts | $19 billion |
| Other Costs | $8 billion |
| Subtotal, Increase Spending and Tax Subsidies | $542 billion |
| Repeal ACA 3.8% Net Investment Income Tax (NIIT) | $158 billion |
| Repeal ACA Health Insurer Tax | $145 billion |
| Repeal ACA Medicare Hospital Insurance 0.9% Surtax | $117 billion |
| Delay ACA “Cadillac Tax” Start Date from 2020 to 2025 | $49 billion |
| Repeal Most Other ACA Tax Increases | $106 billion |
| Subtotal, Repeal ACA Taxes | $575 billion |
| Total Deficit Impact | -$337 billion |
Source: Congressional Budget Office and Joint Committee on Taxation. Note: numbers may not add due to rounding.
The below graph shows the impact of the AHCA on the number of individuals with health insurance, by type, as compared to current law under the ACA:
And here's how the coverage estimate of the AHCA stacks up against other repeal scenarios:

Importantly, CBO’s estimates do not incorporate future changes that could be made to insurance market rules, either by regulation or through further legislation. Such changes have the potential to increase total insurance coverage relative to the AHCA. However, increasing coverage would also likely increase the total cost.
We’ll be producing further analysis of the AHCA, including of the CBO score, in the coming days.
Update 3/14/17 - Added the second graph showing the number of uninsured under various repeal-and-replace scenarios.
Further Readings
- 10 Ideas to Improve the House GOP Obamacare Replacement
- House ACA Replacement Would Accelerate Medicare Insolvency
- What's in the GOP Obamacare Replacement Bill?
- Options to Replace the ACA Cadillac Tax
What's Next
-
Image

-
Image

-
Image