An Overview of the President’s FY 2021 Budget
Moments ago, President Trump released his Fiscal Year (FY) 2021 budget proposal, outlining his tax and spending proposals and their effects on the federal budget for the next decade.
Later today, we will be publishing our full analysis of the President’s budget. This blog provides a brief overview of the budget and its contents. Stay tuned to the Committee for a Responsible Federal Budget and The Bottom Line throughout the day and the rest of the week as we dive deeper into all aspects of the budget.
The Budget Claims Substantial Deficit Reduction
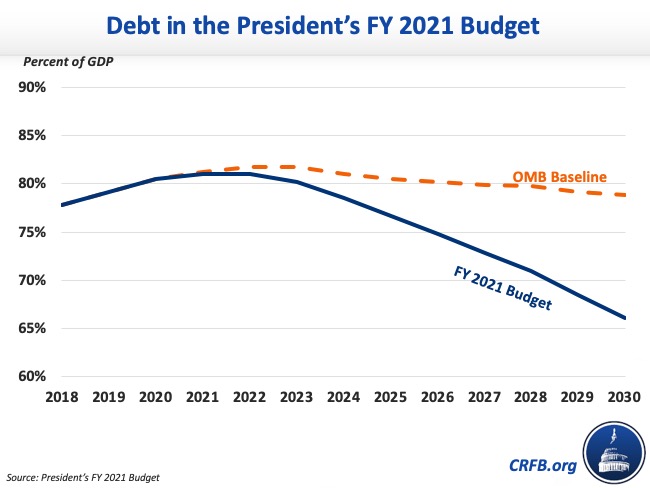
The President's budget claims $4.6 trillion in net deficit reduction over the next decade relative to its own baseline, the result of $585 billion in new tax cuts and spending increases and $5.2 trillion in gross deficit reduction, based on their figures. With these savings, debt would increase slightly from 80 percent of Gross Domestic Product (GDP) today to 81 percent by 2022 and then fall to 66 percent of GDP by 2030. By comparison, debt would hold steady around 80 percent of GDP and be on a slightly declining path under the Office of Management and Budget's (OMB) baseline (which bases its estimates on overly optimistic forecasts of economic growth). Under CBO's baseline, debt would rise to 98 percent of GDP by 2030.
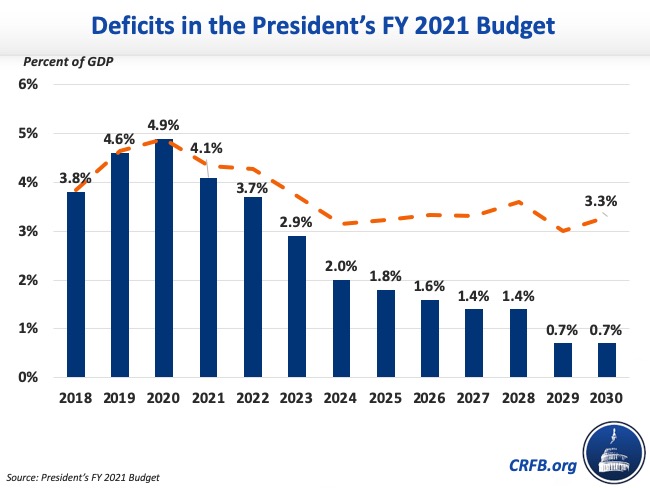
The President's budget estimates it will balance the budget by 2035. Deficits would peak at 4.9 percent of GDP, or $1.1 trillion, in 2020 and then fall gradually to 0.7 percent of GDP, or $261 billion, by 2030. For comparison, OMB's baseline projects a deficit of 3.3 percent of GDP in 2030 (again with overly generous assumptions about economic growth). CBO projects deficits will reach 5.4 percent of GDP, or $1.7 trillion, in 2030.
The Budget Includes Significant Revenue and Spending Proposals
By its own estimates, the budget proposes $585 billion of new initiatives and $5.2 trillion of budgetary savings, for net savings of $4.6 trillion. The largest spending cut in the budget comes from $1.55 trillion in cuts to non-defense discretionary programs, generated by reducing nominal spending 5 percent between 2020 and 2021 and an additional 2 percent each year thereafter. Significant further savings are generated from changes to health care, welfare programs, and reductions and reforms to other parts of the budget.
The budget also assumes in its baseline the extension of the individual income tax provisions in the Tax Cuts and Jobs Act (TCJA) beyond their December 2025 expiration. This alone adds $1.5 trillion to the debt, reducing net savings to $3.2 trillion.
As a result of these policies and current law trends, spending under the President's budget would fall from 21.6 percent in 2020 to 19.1 percent by 2025 and 18.4 percent in 2030. Revenue, meanwhile, would grow from 16.7 percent of GDP in 2020 to 17.3 percent in 2025 and 17.6 percent of GDP in 2030.
Key Numbers in the President's Budget
| 2019 | 2020 | 2021 | 2022 | 2023 | 2024 | 2025 | 2026 | 2027 | 2028 | 2029 | 2030 | Ten-Year* | |
|---|---|---|---|---|---|---|---|---|---|---|---|---|---|
| Revenue | |||||||||||||
| % of GDP | 16.3% | 16.7% | 16.5% | 16.6% | 16.9% | 17.2% | 17.3% | 17.3% | 17.4% | 17.5% | 17.6% | 17.6% | 17.2% |
| Outlays | |||||||||||||
| % of GDP | 21.0% | 21.6% | 20.7% | 20.4% | 19.8% | 19.2% | 19.1% | 19.0% | 18.8% | 19.0% | 18.3% | 18.4% | 19.3% |
| Deficit | |||||||||||||
| $ (billions) | $984 | $1,083 | $966 | $920 | $746 | $552 | $527 | $481 | $435 | $475 | $250 | $261 | $5,613 |
| % of GDP | 4.6% | 4.9% | 4.1% | 3.7% | 2.9% | 2.0% | 1.8% | 1.6% | 1.4% | 1.4% | 0.7% | 0.7% | 2.1% |
| Debt Held by the Public | |||||||||||||
| $ (trillions) | $16.8 | $17.9 | $18.9 | $19.9 | $20.7 | $21.3 | $21.8 | $22.4 | $22.8 | $23.4 | $23.6 | $23.9 | N/A |
| % of GDP | 79.2% | 80.5% | 81.0% | 81.0% | 80.2% | 78.5% | 76.7% | 74.8% | 72.8% | 71.0% | 68.5% | 66.1% | N/A |
Source: Office of Management and Budget. Note: numbers are adjusted for timing shifts. *Ten-year figures reflect the 2021-2030 budget window.
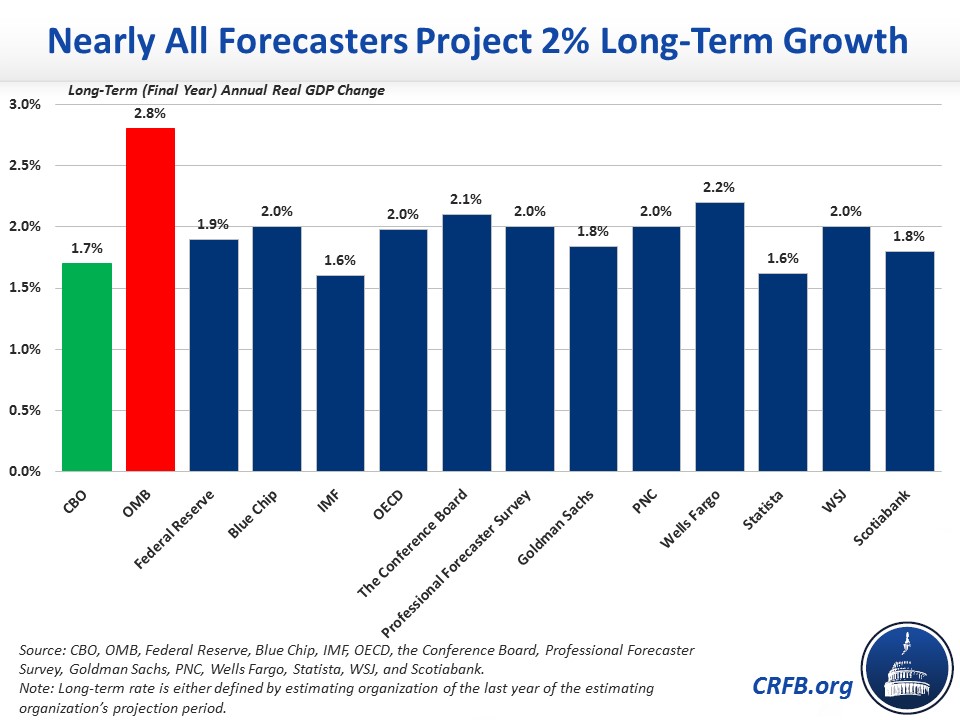
The Budget Relies on Overly Optimistic Assumptions of Economic Growth
Similar to the previous three years, the budget relies on overly optimistic economic assumptions and budget gimmicks that inflate its savings and distract from its actual policy reforms. The budget assumes annual real GDP growth at 3.1 percent for 2021, 3 percent through 2025, and averaging 2.9 percent over the decade. This is estimate is about 50 percent higher than those from other forecasters, who project annual growth around (and in some cases less than) 2 percent per year.
Absent these assumptions, debt under the President’s budget would be much worse. Debt would be $4.5 trillion higher in 2030, and it would rise to roughly 89 percent of GDP rather than falling to 66 percent by 2030.
****
The Committee for a Responsible Federal Budget will publish a more detailed analysis of the President’s FY 2021 budget later today and over the course of the week. Our analyses of past budget proposals can be found here.