The Decade in the Federal Budget
When it comes to fiscal policy, the 2010s have been quite a rollercoaster. Below, we’ve identified a few major budgetary trends and patterns of the last decade.
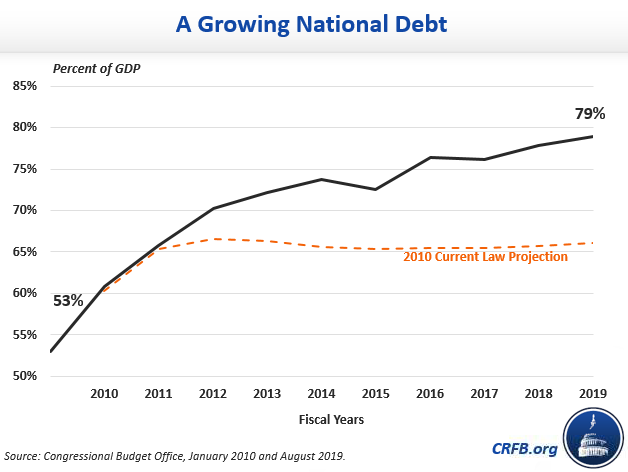
A Growing National Debt
Over the past decade, debt has grown significantly as a share of the economy. In January 2010, debt totaled 53 percent of Gross Domestic Product (GDP) – up 18 points from the mid-2000s due to the Great Recession. Since then, debt has risen to 79 percent of GDP at the end of fiscal year 2019.
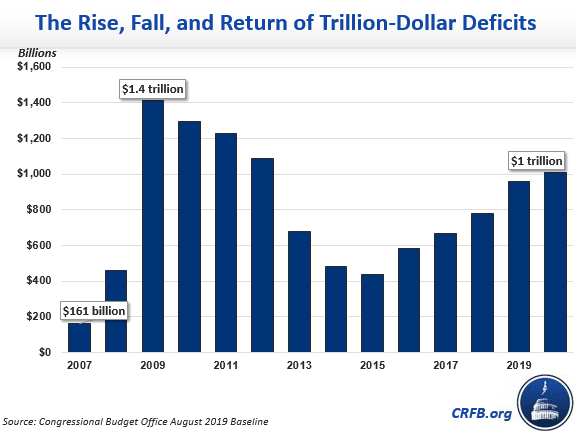
The Rise, Fall, and Return of Trillion-Dollar Deficits
The beginning of the decade saw the emergence of deficits exceeding a trillion dollars as a result of the Great Recession and the measures enacted to combat it. Deficits were $1.3 trillion in 2010 and 2011 and $1.1 trillion in 2012 – before the improving economy and deficit reduction measures shrunk the deficit to $680 billion in 2013 and to a low of $442 billion in 2015. After that, deficit-increasing legislation along with other factors caused deficits to grow continuously to $665 billion in 2017 and $984 billion in 2019. As a share of the economy, revenues shrank and spending remained constant between 2015 and 2018.
The deficit is expected to top $1 trillion again in 2020 and grow in future years.
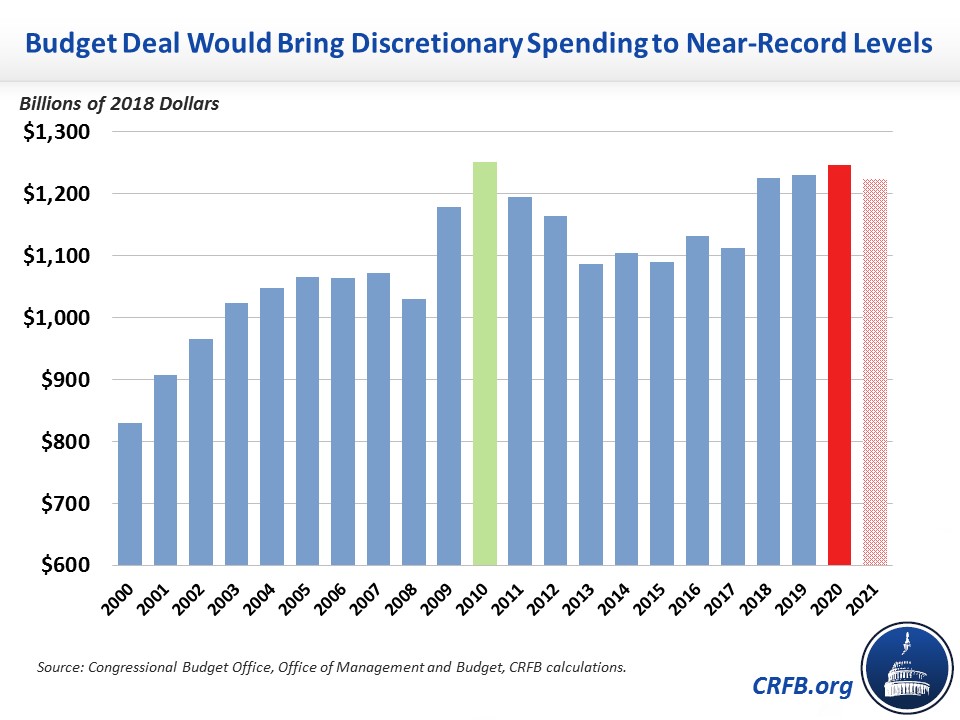
The Building and Breaking of Discretionary Spending Caps
2010 represented a high water mark for discretionary spending in real dollars. Then, the Budget Control Act of 2011, the major piece of deficit reduction legislation enacted this decade, reduced and capped discretionary spending for ten years. It called for further spending reductions after a "Super Committee" failed to negotiate an additional $1.2 trillion of savings. Budget agreements in 2013 and 2015 partially rolled back the sequester and, fortunately, fully offset the cost, but agreements in 2018 and 2019 fully repealed the sequester and increased spending further, largely without offsets.
As a result, spending levels are almost back up to 2010 levels after adjusting for inflation. Spending caps are set to end entirely after 2021.
Tax Cut After Tax Cut After Tax Cut
Several major tax cuts were enacted throughout the decade. The early part of the decade saw lawmakers grappling with the expiration of the 2001/2003 tax cuts, which they dealt with by temporarily extending all of them in 2010 then permanently extending most of them without offsets in 2013. Further cuts in 2015 extended or made permanent several tax extenders and delayed three taxes from the Affordable Care Act (ACA). 2017 saw the passage of the Tax Cuts and Jobs Act, which reduced individual and corporate income taxes. Earlier this month, lawmakers permanently repealed the three ACA taxes.
Major Tax Cut Legislation of the 2010s
| Year | Bill | Cost Over Ten Years |
|---|---|---|
| 2010 | Tax Relief, Unemployment Insurance Reauthorization, and Job Creation Act of 2010 | $858 billion |
| 2013 | American Taxpayer Relief Act of 2012 | $3.9 trillion |
| 2015 | Protecting Americans from Tax Hikes Act of 2015 | $680 billion |
| 2017 | Tax Cuts and Jobs Act | $1.8 trillion |
| 2019 | Further Consolidated Appropriations Act, 2020 | $426 billion |
Sources: Congressional Budget Office and Joint Committee on Taxation. Bills are scored over the ten windows following enactment, so the totals cover different budget windows. Tax Cuts and Jobs Act shown here without interest or dynamic effects to be comparable with other scores; it would cost $1.9 trillion with those effects.
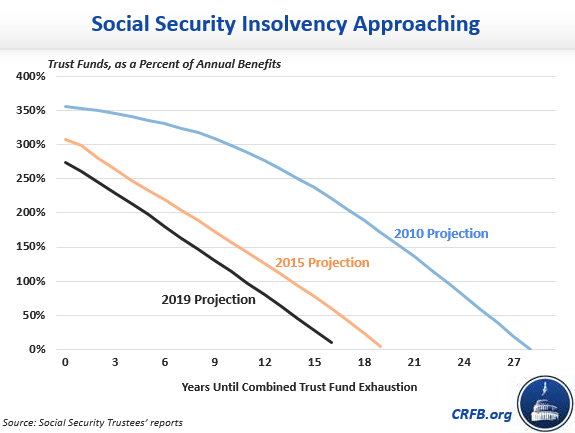
A Lost Decade for Saving Social Security and Medicare
Lawmakers have not addressed Social Security solvency despite long-term projections that have told a consistent story throughout the decade reiterating that action is needed. In 2010, the combined Social Security Trust Funds were projected to become insolvent in 2037 – 27 years later. Today, Social Security's exhaustion date is still projected for around the same time (2035), but insolvency is a decade closer.
The passage of the ACA at the beginning of the decade extended the solvency of the Medicare Hospital Insurance (HI) trust fund by several years, but nothing has been done to improve Social Security's and Medicare's finances since then. While lawmakers and policy experts have proposed plans to achieve solvency for both programs, no proposals have actually passed. The HI trust fund is projected to be exhausted in seven years, while the Social Security trust funds are projected for insolvency within 15 years.