Could a COVID Relief Deal Close the Output Gap?
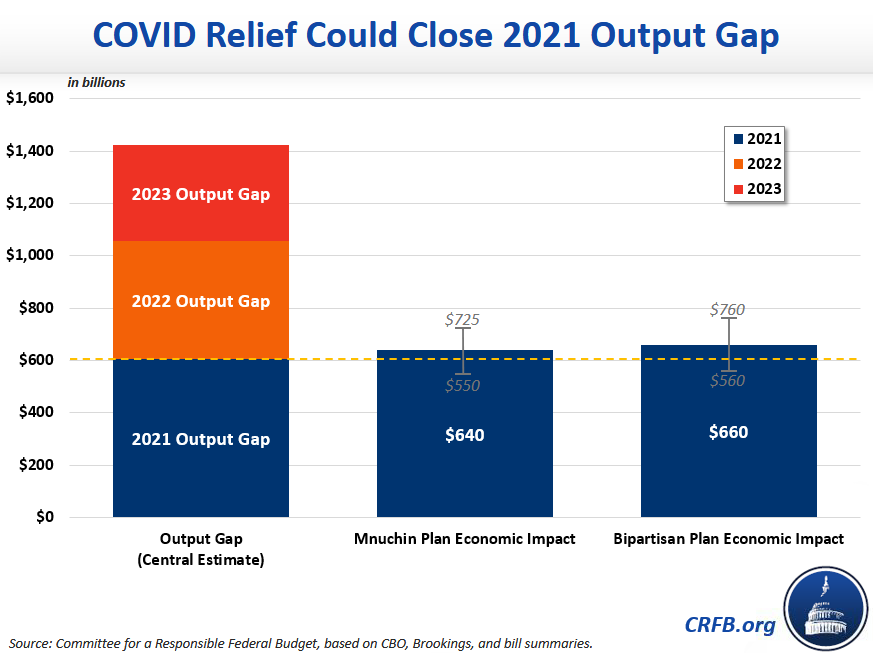
Policymakers from both parties have endorsed plans to provide over $900 billion of COVID relief as part of a year-end funding deal. Democratic leadership has called for something similar to the $908 billion package introduced by a bipartisan group of Senators and House members, while Republican leadership has reportedly endorsed a $916 billion offer put forward by Treasury Secretary Steve Mnuchin. Though the packages differ in significant ways, we estimate both would boost economic output enough to close almost half of the output gap over the next three years – which would be equivalent to fully closing the output gap for 2021.
Using simplified multipliers from the Congressional Budget Office (CBO) and the Brookings Institution, we estimate Secretary Mnuchin's plan would boost the economy by about $640 billion (within a range of $550 to $725 billion), while the bipartisan plan would boost output by $660 billion (within a range of $560 to $760 billion). Assuming our midpoint estimate for this economic boost and underlying GDP, this would be enough in both cases to boost GDP by roughly 1 percent over the next three years – the equivalent of boosting it by 3 percent in 2021.

Importantly, we do not account for the effects the plans might have on expediting the end of the COVID pandemic, nor the impact of other non-fiscal policies such as changes to COVID liability rules. Our estimates are based on the original plans as we understand them, though negotiations are ongoing and the actual fiscal impact could differ from reported figures. There is tremendous uncertainty surrounding the multiplier of various policies and the output gap itself, and the macroeconomic impact of these plans should be just one of many important considerations.
While it is appropriate to enact deficit-increasing legislation in response to a national emergency, both proposals would add to the debt and would also slightly reduce long-term economic output if not offset with future legislation. Based on recent estimates of COVID relief from CBO, we believe GDP would be roughly 0.1 percent smaller in 2030 if either of these packages were enacted.
How Much Will COVID Relief Boost GDP?
So far, Congress has enacted the equivalent of $2.7 trillion of net COVID relief, most of which has already been spent (see more at www.COVIDMoneyTracker.org). This money was mainly used for expanded unemployment benefits, recovery rebates, aid and loans to small businesses, support for Federal Reserve facilities, funding to states and localities, support for schools and health providers, and direct responses to the public health crisis. CBO has analyzed $2.6 trillion of this response and found it will boost GDP by about $1.5 trillion through 2023 – suggesting an average fiscal multiplier of 0.58x.
Both the Mnuchin and bipartisan packages would extend, expand, adjust, or revive many elements of COVID relief by offering more forgivable Paycheck Protection Program (PPP) loans to small businesses, distributing aid to state and local governments and school districts, and fund other priorities such as vaccine distribution, support for airline workers, and support for health providers. The bipartisan plan also includes a substantial extension and expansion of unemployment benefits (the Mnuchin plan includes a modest extension), while the Mnuchin plan includes $600 per person recovery rebates. Both plans also include some COVID-related liability protections for employers, though the Mnuchin plan is reportedly much more aggressive (we do not account for this in our analysis).
To estimate the economic impact of the proposed packages, we assume the fiscal impact of the bipartisan plan matches summary figures put forward by the negotiators last week, while the Mnuchin offer matches the recent McConnell proposal except where modified based on press reports. We group all policies into one of five categories – unemployment benefits, PPP and other small business support, state and local aid (including education funding), stimulus checks, and other spending and revenue.
Using these categories, we generate a low-impact estimate using the same category fiscal multipliers estimated by CBO for enacted COVID relief. We expect the actual GDP impact to be higher than previous CBO projections – both because less social distancing will increase the share of funds spent rather than saved, and because the policies themselves are better targeted than earlier COVID relief. For example, a $300 weekly unemployment bonus should have a higher multiplier than a $600 bonus, and PPP targeted at struggling small businesses should have a higher multiplier than broadly available PPP funds. For our high-impact estimates, we use multipliers suggested by Wendy Edelberg and Louise Sheiner at the Brookings Institution, and further boost the assumed PPP multiplier to account for its targeting.
Based on these categorical multipliers, we estimate the Mnuchin plan would have an overall multiplier of 0.60x to 0.80x and the bipartisan plan would have an overall multiplier of 0.62x to 0.84x. As a result, we estimate the Mnuchin plan would boost GDP by $550 to $725 billion, while the bipartisan plan will boost GDP by $560 to $760 billion.
Estimated GDP Boost From COVID Relief Proposals (billions)
| Mnuchin Plan | Bipartisan Proposal | |||||
|---|---|---|---|---|---|---|
| Category | Low | Central | High | Low | Central | High |
| Unemployment Benefits | $25 | $40 | $50 | $120 | $175 | $235 |
| Paycheck Protection Program and Other Small Business Support | $115 | $140 | $160 | $105 | $125 | $145 |
| State and Local Aid (including Education Funding) | $230 | $245 | $260 | $215 | $225 | $240 |
| Stimulus Checks | $90 | $120 | $150 | N/A | N/A | N/A |
| Other Spending and Revenue | $90 | $95 | $100 | $125 | $130 | $140 |
| Total | $550 | $640 | $725 | $560 | $660 | $760 |
| Overall Multipliers | 0.60x | 0.70x | 0.79x | 0.62x | 0.73x | 0.84x |
| Total Cost (Estimated Effect on Deficit) | $916 billion | $908 billion | ||||
Totals may not sum due to rounding. CRFB calculations based on CBO data.
Taking the average between our estimates, the Mnuchin plan would boost GDP by $640 billion (a 0.70x multiplier) while the bipartisan plan would boost it by $660 billion (a 0.73x multiplier).
Will COVID Relief Close the Output Gap?
Effective fiscal stimulus works mainly by reducing the output gap, the difference between expected economic output under current law and possible economic output if the economy were operating at full potential (read more in our recent paper Comparing Fiscal Multipliers). Given the nature of the pandemic and the time it takes to rebuild an economy, it is extremely unlikely any amount of fiscal stimulus could literally close the entire output gap for 2021 in just one year. However, we estimate both plans would spur enough economic activity to close the equivalent of the 2021 output gap over a three year period, with the vast majority of that boost materializing over two years.
Based on CBO's July projections and more recent economic data, we believe the output gap is on course to total between $300 and $900 billion in 2021, with our central estimate at just above $600 billion. The range of uncertainty is even wider over the three-year period, given tremendous uncertainty over how fast the economy will recover as people start to get vaccinated, but our midpoint estimate is roughly $1.4 trillion.
Assuming our midpoint multiplier and GDP estimates, both plans would generate enough economic activity to close the equivalent of the 2021 output gap, 60 percent of the projected output gap over the next two years, and 45 percent of the output gap over three years. Given uncertainty regarding the economic impact of the plans and the output gap, actual results could differ.
In terms of overall output, we estimate both plans would boost GDP by about 1 percent over the 2021 through 2023 period, with the bipartisan plan offering a slightly larger boost. This would be the equivalent of a 3 percent boost in 2021, though we believe some of the economic impact will occur in 2022 and a very small amount in 2023.
* * * * *
Both Democrats and Republicans have endorsed COVID relief packages above $900 billion. In our central estimate, we find the bipartisan package with Democratic support would boost GDP by $660 billion while the Mnuchin package with Republican support would boost GDP by $640 billion. We find this would be enough to do the equivalent of closing the entire output gap for 2021, though some of the economic impact would not take place until 2022 or later.
While we find the aggregate macroeconomic impact of the packages would be similar, the packages would differ in terms of who benefits from their economic boost and by how much. Those negotiating COVID relief should consider these questions, as well as the potential effects of any package on output, employment, poverty, household income, business stability, public health, and long-term growth. They should also consider the substantial uncertainty associated with any multiplier or output gap estimate.
Methodology Appendix
Our economic impact estimates for the two COVID relief proposals are rough, and based on applying broad fiscal multipliers to different policy areas. As a starting point, we assume the net fiscal impact of each proposal is equal to its reported cost. We used the totals from the bipartisan plan reported last week, and assume that the Mnuchin plan is a modified version of the McConnell plan released last week with the differences that have been reported in press outlets. We then divide the proposals into five types of policies – unemployment benefits, support for small businesses (mainly through the Paycheck Protection Program), aid to state and local governments (including education spending), rebate checks, and other spending and taxes. We did not estimate the effect of liability protections nor COVID testing and vaccinations, though the effect of ending the pandemic earlier than expected could be substantial.
In September, CBO estimated the effect of enacted COVID relief legislation using similar categories. Our low estimate relies on the same multipliers as assumed by CBO; 0.67x for unemployment, 0.36x for PPP and small business support, 0.60x for rebates, and 0.88x for state and local government aid. We assumed a multiplier of 0.63x for other spending and tax breaks, consistent with CBO’s estimates.
We believe actual multipliers will be larger than CBO’s prior estimates for at least two reasons. First, CBO’s estimates assumed that intense social distancing resulting from the pandemic reduced the amount of fiscal support consumed by households; this social distancing has already abated substantially and is likely to further fade as more Americans receive a COVID-19 vaccine. Second, new COVID relief proposals are better targeted than COVID legislation enacted earlier in the year. For example, the bipartisan bill includes a $300 per week enhancement of unemployment benefits; on a per dollar basis, this is likely to have a larger positive effect on consumer demand and smaller negative effect on labor supply than the $600 enhancement enacted under the CARES Act. As another example, the Paycheck Protection Program under the McConnell bill offers forgivable loans only to businesses with under 300 employees who have experienced at least a 25 percent reduction in comparative quarterly revenues in 2019 to 2020, and only up to a maximum loan amount of $2 million. By comparison, original PPP loans went to businesses with up to 500 employees with no loss requirement for up to $10 million. As a result, a much larger share of the original PPP represented a windfall to businesses who would have survived and kept workers without the support (or with less support).
Our high-end multiplier estimates for unemployment benefits, state and local aid, rebates, and other spending – 1.3x, 1.0x, 1,0x, and 0.7x, respectively — are based on a paper by Wendy Edelberg and Louise Sheiner of the Brookings Institution. Those authors estimate a 0.4x multiplier for small business support similar to the PPP; we assume 0.5x based on the fact that new support is better targeted than the original PPP.
Our central estimates represent a simple average of the low- and high-end multipliers.
| Category | Low | Central | High |
|---|---|---|---|
| Unemployment Benefits | 0.67x | 0.99x | 1.3x |
| Paycheck Protection Program and Other Small Business Support | 0.36x | 0.43x | 0.5x |
| State and Local Aid (including Education Funding) | 0.88x | 0.94x | 1.0x |
| Stimulus Checks | 0.60x | 0.80x | 1.0x |
| Other Spending and Revenue | 0.63x | 0.66x | 0.7x |
| Total | 0.62x | 0.73x | 0.84x |
Our GDP and output gap estimates are based on CBO’s July’s estimates, but adapted based on actual reported Q3 GDP, which was higher than CBO estimated.
In its latest projections, CBO estimated GDP would decline from an annualized level of $21.5 trillion in the first quarter of 2020 to $19.2 trillion in the second quarter, and then increase to $20.1 trillion in the third quarter. Based on the latest estimates from the Bureau of Economic Analysis, however, third quarter GDP actually grew to $21.2 trillion – a level CBO did not project until the second quarter of 2021.
To account for this much stronger economic activity, we adjust CBO’s GDP estimates through a pessimistic and optimistic approach. Both scenarios replace CBO’s 2020 second and third quarter projections with BEA’s estimates of actual GDP, and both scenarios update all nominal figures to account for changes in the inflation rate. Beyond Q3 of 2020, our pessimistic approach assumes nominal GDP remains flat for two quarters until it ultimately converges with CBO’s prior estimates in the second quarter of 2021 and beyond; this scenario essentially assumes a modest dip in real GDP over the winter. In our optimistic scenario, we assume the economy will grow at the rate CBO had projected once it reached current levels – essentially bringing all GDP estimates forward three quarters – until it reaches potential; the scenario assumes a full recovery by the end of 2023.
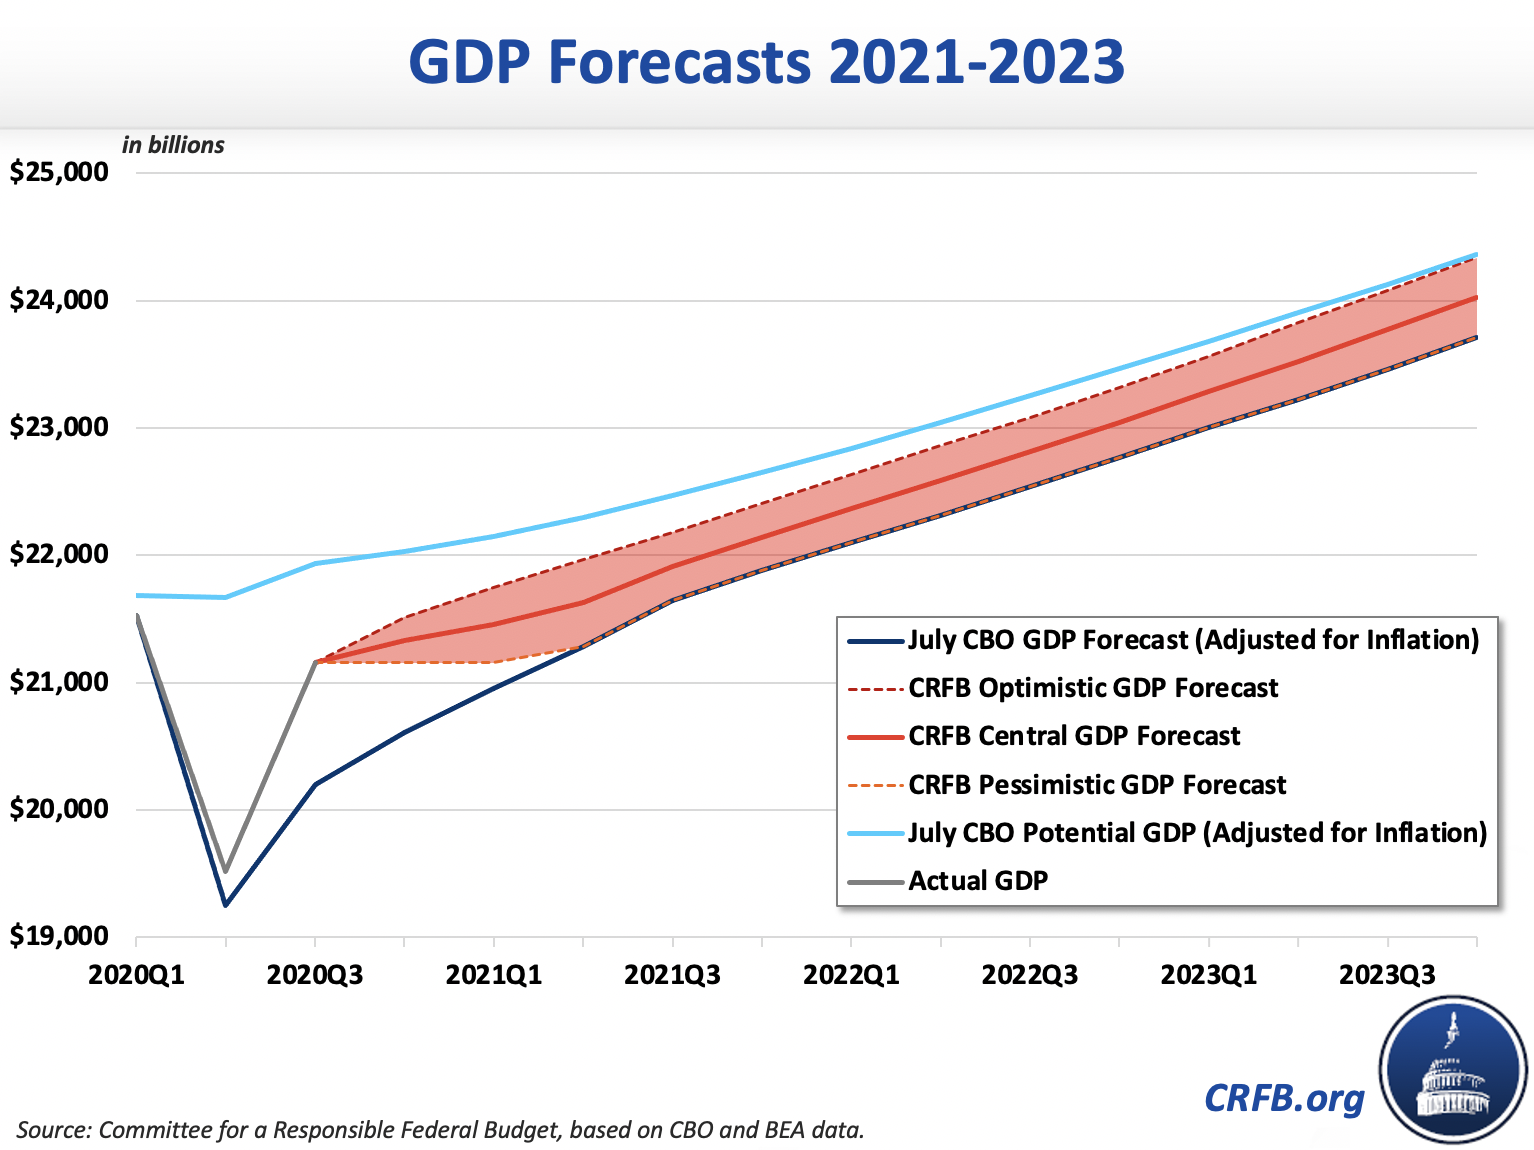
Most independent GDP forecasts we reviewed suggested GDP growth and levels somewhere between these two scenarios – in most cases closer to the optimistic scenario than the pessimistic one. For purposes of our estimates, we assume GDP levels exactly halfway between our optimistic and pessimistic scenarios.
To estimate the output gap, we assume CBO’s potential GDP estimates are unchanged except to account for different inflation and price levels. The result is an output gap of $900 billion over 1 year and $2.3 trillion over 3 years in our pessimistic scenario and $315 billion over 1 year and $560 billion over 3 years in our optimistic scenario. Our central estimate takes a simple average, leading to an output gap of $605 billion for 2021 or $1.4 trillion for the 2021 to 2023 period.
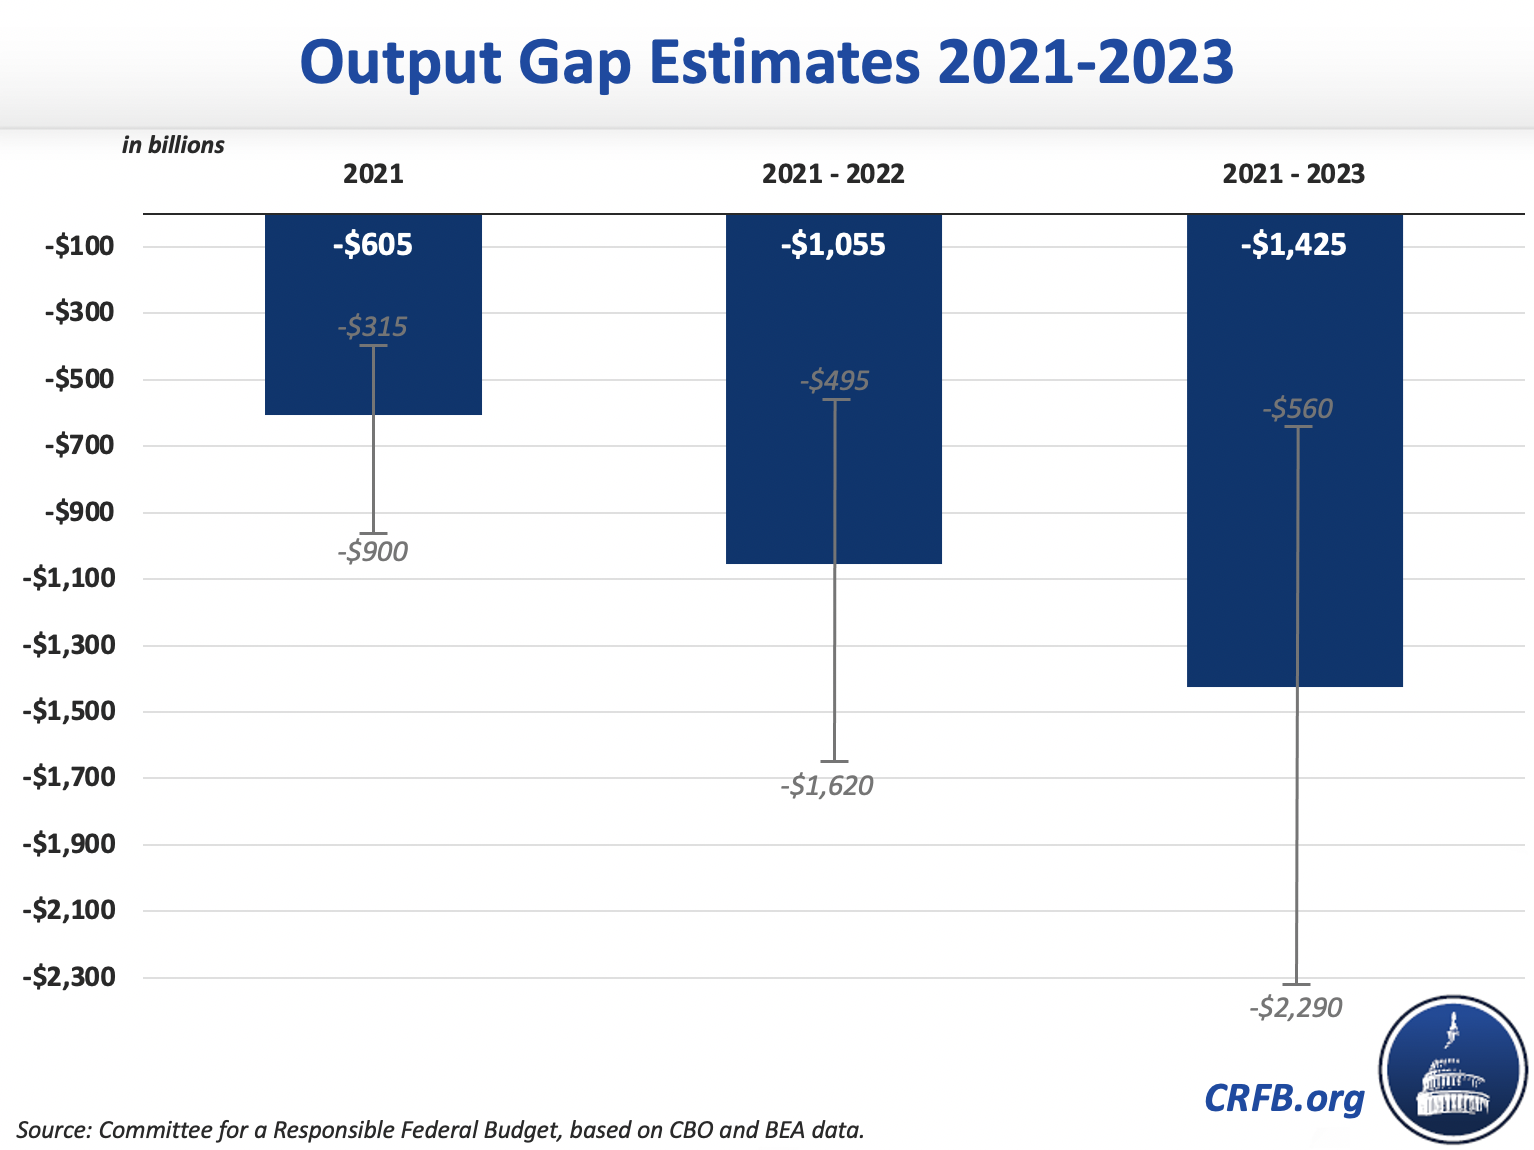
While our potential GDP estimates are based on CBO's current projections, potential GDP is a theoretical concept and could be higher or lower than reported. If real potential GDP per adult matched CBO's pre-COVID projections, the 2021 output gap would be about $100 billion higher. Similarly, if 2019 GDP levels were assumed to be at potential rather than nearly 1 percent above potential as CBO estimated, the 2021 output gap could be $200 billion higher. On the other hand, assuming a natural rate of unemployment (NAIRU) of around 5 percent — as was widely believed as recently as 2016 — the output gap would be about $200 billion smaller.
Note: This analysis was updated on 12/10/2020 to clarify uncertainties around using CBO's current potential GDP estimates.
This blog post is a product of the COVID Money Tracker, a new initiative of the Committee for a Responsible Federal Budget focused on identifying and tracking the disbursement of the trillions being poured into the economy to combat the crisis through legislative, administrative, and Federal Reserve actions.