Promises and Price Tags: A Fiscal Guide to the 2016 Election
NOTE: This is an old version of this analysis and contains out-of-date estimates with policies proposed through June 24, 2016. It has been updated with a new analysis covering policies released by the campaigns through September 22. See the latest.
"Promises and Price Tags" is a comprehensive fiscal analysis of the policies put forward by presidential candidates Donald Trump and Hillary Clinton. The full report is available as a printer-friendly PDF (57 pp.), and the Chartbook can be viewed here. The executive summary is below.
Executive Summary
The next president will confront a number of fiscal challenges during his or her tenure, including growing deficits, virtually unprecedented levels of debt, and an aging population. Currently, debt held by the public totals $14 trillion, or 75 percent of Gross Domestic Product (GDP), which is nearly twice the historic average and the highest share of the economy other than right after World War II. The debt is projected to grow as a share of the economy to almost 86 percent by 2026 and close to 130 percent by 2040.
This growing debt is largely the result of rising entitlement spending and growing interest costs. Social Security, federal health spending, and interest costs are projected to be responsible for over four-fifths of spending growth over the next decade, with interest being the fastest growing area of the budget.
Ever-rising levels of debt are unsustainable, meaning that at some point policymakers will need to slow spending growth, increase revenue, or do both. The national discussion surrounding and the political promises made during the 2016 election can lay the foundation for necessary changes in fiscal policy.
Encouragingly, both of the major parties’ presumptive presidential nominees have highlighted the need for fiscal responsibility on the campaign trail. Unfortunately, to date neither former Secretary of State Hillary Clinton nor businessman Donald Trump has put forward a plan to address the national debt, and Mr. Trump’s proposals would massively increase the debt.
Figure 1: Key Findings By Candidate Under Our Central Estimates
| Clinton | Trump | |
|---|---|---|
| 10-Year Increase in Revenue | $1.20 trillion | -$10.50 trillion |
| 10-Year Increase in Primary Spending | $1.40 trillion | -$0.65 trillion |
| 10-Year Increase in Interest Costs | $0.05 trillion | $1.70 trillion |
| Total 10-Year Increase in Debt | $0.25 trillion | $11.50 trillion |
| 10-Year Revenue as a Share of GDP (current law: 18.1%) | 18.6% | 13.6% |
| 10-Year Spending as a Share of GDP (current law: 22.1%) | 22.7% | 22.5% |
| 10-Year Deficit as Share of GDP (current law: 4.0%) | 4.1% | 9.0% |
| Debt as a Share of GDP in 2026 (current law: 86%) | 87% | 127% |
Note: numbers may not add due to rounding. Estimates relative to current law.
Fiscal FactCheck is a project of the Committee for a Responsible Federal Budget developed to highlight issues of fiscal importance in the 2016 presidential campaign by holding candidates accountable for fiscal claims made on the campaign trail and for the likely budgetary costs and savings of their policy proposals. In “Promises and Price Tags: A Fiscal Guide to the 2016 Election,” we analyze the major proposals from the candidates as of June 24, 2016. Using credible outside sources as well as our own estimates for each policy, we generate a low, central, and high cost estimate of the fiscal implications of Trump’s and Clinton’s proposals to date. Our estimates are rough, rounded, and based on our understanding of the candidates’ policy proposals and details; they do not represent a final analysis. As candidates continue to add to and clarify their policy proposals, we will continue to update our estimates.
How Do The Numbers Add Up?
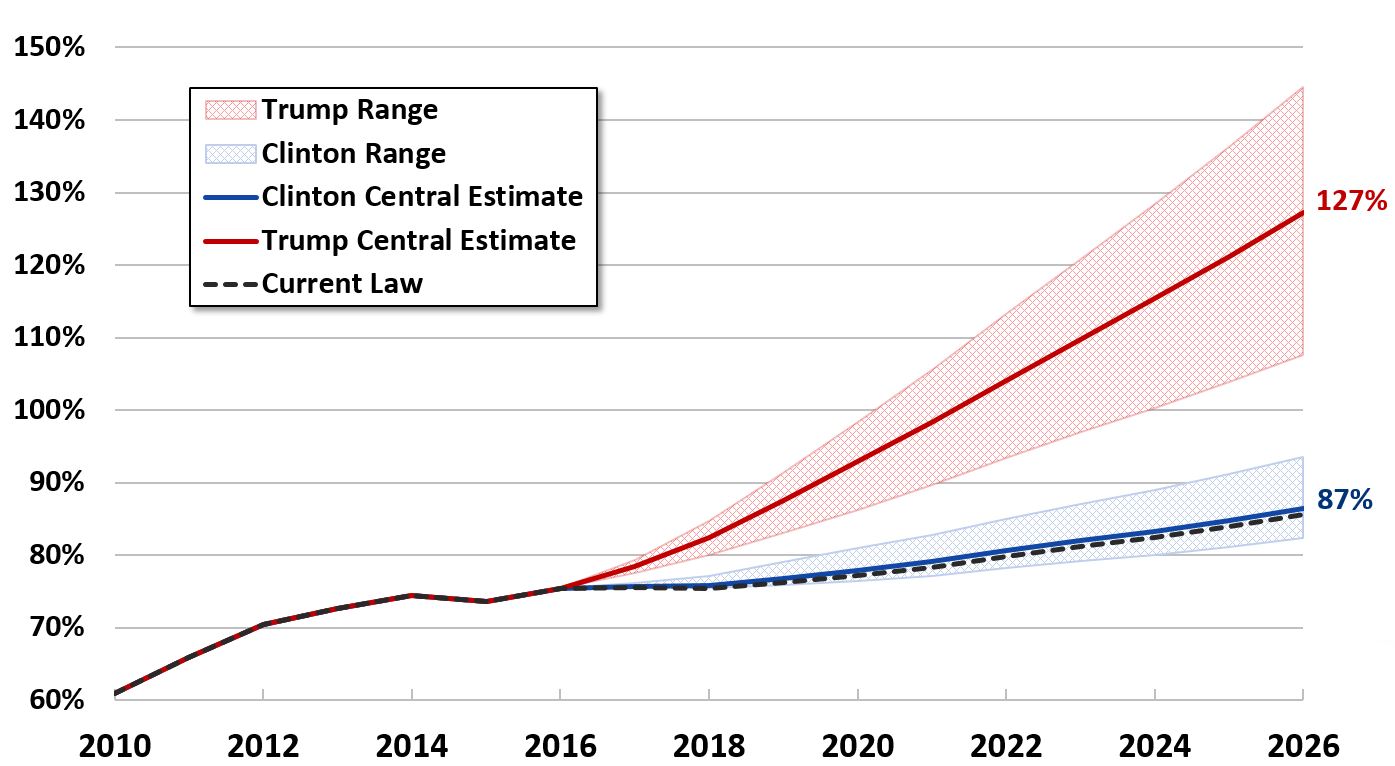
According to our central estimates, both candidates would worsen the debt relative to today’s level as well as projected levels under current law. The nonpartisan Congressional Budget Office (CBO) projects that, under current law, nearly $10 trillion will be added to the debt over the next ten years, bringing debt to 86 percent of GDP by 2026. Clinton would add a further $250 billion to the debt over a decade, bringing it to 87 percent of GDP by 2026. Over the same period, Trump would add $11.5 trillion, causing debt to rise to 127 percent of GDP by 2026.
Figure 2: Debt Under Candidates' Proposals (Percent of GDP)
For Clinton, this small increase in debt relative to current law is the result of spending increases that are largely but not entirely paid for by revenue increases. On net, Clinton would increase spending by $1.45 trillion over ten years, from 22.1 to 22.7 percent of GDP. She would also increase revenue by $1.2 trillion over ten years, from 18.1 to 18.6 percent of GDP.
For Trump, significant increases in current law debt are primarily the result of very large reductions in revenue. His plan would cut net taxes by $10.5 trillion over a decade, dropping revenue from 18.1 to 13.6 percent of GDP. He would also reduce non-interest spending by about $650 billion, but interest costs would increase due to higher debt levels and thus net spending would rise by over $1 trillion over a decade, from 22.1 to 22.5 percent of GDP.
Figure 3: Ten-Year Spending, Revenue, and Deficits Under Our Central Estimates (Percent of GDP)
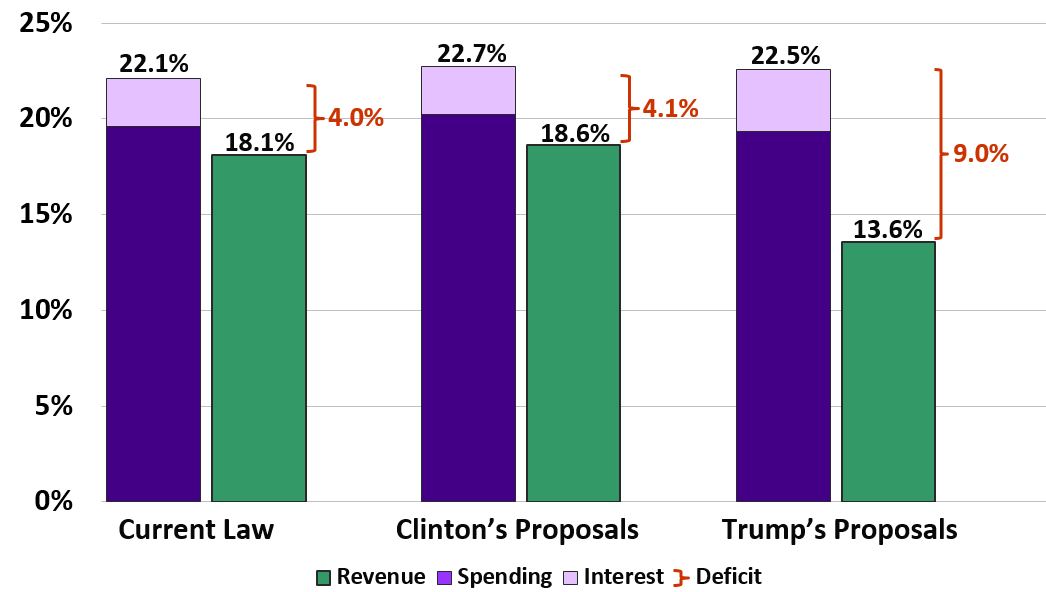
Note: Spending and revenue calculations are based on CBO’s 10-year projection of cumulative GDP between 2017-2026.
Most of Clinton’s costs would come from spending increases in non-health, non-retirement programs. She would spend $350 billion more on college education, $300 billion more on infrastructure, another $300 billion on paid family leave, and nearly half a trillion on a variety of other initiatives. Clinton would also make several health-related changes that on net would cost about $150 billion. To offset most of these costs, Clinton proposes a variety of tax increases – mostly on higher earners and businesses – totaling $1.25 trillion.
The largest share of Trump’s deficit impact comes from his proposed individual and business tax reforms, which would reduce revenue by about $9.25 trillion. His plan to reform the veterans affairs system and increase veterans’ access to private doctors would cost about $500 billion. And his plans to repeal and replace the Affordable Care Act and reduce illegal immigration would cost about $50 billion each.
Figure 4: Summary of Candidates' Policy Proposals Under Central Estimates,
Ten-Year Costs / Savings (-)
| Proposal | Clinton | Trump |
|---|---|---|
| Health Policies | $0.15 trillion | $0.05 trillion |
| Tax Policies | -$1.25 trillion | $9.25 trillion |
| Spending Policies | $1.40 trillion | $0.50 trillion |
| Immigration Policies | -$0.10 trillion | $0.05 trillion |
| Social Security Policies | n/a | n/a |
| Subtotal, Proposals | $0.20 trillion | $9.85 trillion |
| Net Interest | $0.05 trillion | $1.70 trillion |
| Total Budgetary Impact | $0.25 trillion | $11.50 trillion |
| Memo: Low to High Cost Estimates | -$0.15 to $2.20 trillion | $9.70 to $16.30 trillion |
Note: numbers may not add due to rounding.
What Would It Take To Address Our Fiscal Challenges?
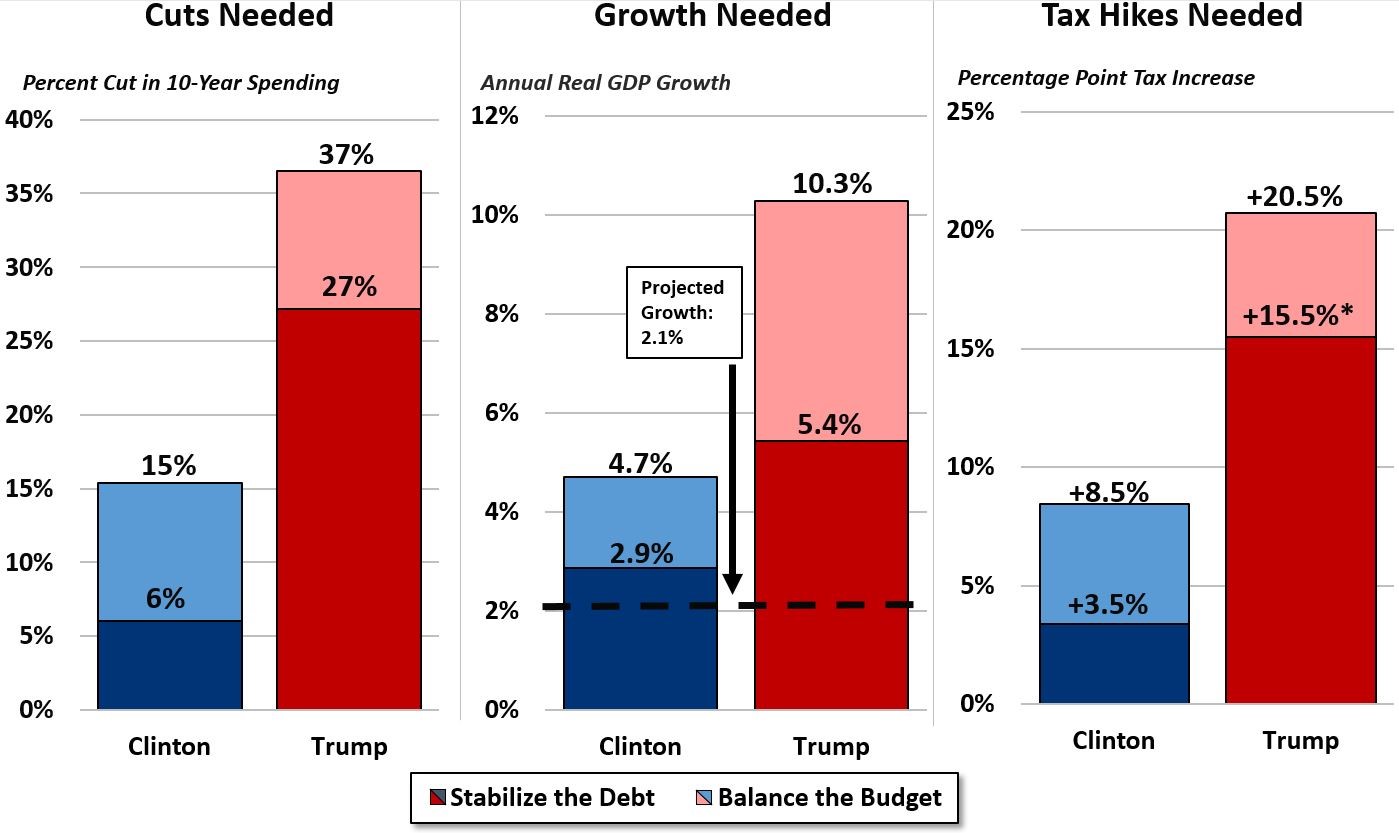
Assuming the enactment of either of these plans – and particularly Trump’s plan – putting the budget on a sustainable path will likely prove challenging. Relative to current law, it would require $2.9 trillion to stabilize the debt as a share of GDP and $7.8 trillion to balance the budget after ten years. A responsible fiscal plan would aim to achieve a target somewhere between these two goals.
For Clinton, putting the debt on a sustainable path after enacting her plan would require cutting total spending by 6 to 15 percent, increasing all tax rates by 3.5 to 8.5 percentage points, accelerating real economic growth by 35 to 125 percent, or some combination.
For Trump, putting the debt on a sustainable path after enacting his plans would require cutting total spending by 27 to 37 percent, increasing all tax rates by 15.5* to 20.5 percentage points, accelerating real economic growth by 160 to 390 percent, or some combination.
Figure 5: Attaining Fiscal Sustainability Under the Candidates' Plans,
Assuming Our Central Estimates
Since both candidates have taken parts of the budget and tax code off the table, the actual task of putting the budget on a sustainable path will be more challenging. For example, were Clinton to make the debt sustainable only by increasing tax rates on income above $250,000, it would require a top income tax rate of 64 percent to stabilize the debt – likely at or above the revenue-maximizing level when other taxes are included. It would likely be impossible for her to balance the budget through tax rate increases on high earners alone.
Similarly, were Trump to make the budget sustainable by only cutting non-Social Security, non-Medicare spending, all other spending would need to be cut by 50 to 67 percent– a clearly unrealistic magnitude of spending cuts, particularly given Trump’s other goals that would likely result in spending increases.
Both candidates will likely have to adjust their plans, put all areas of the budget and tax code on the table, and pursue an “all of the above” approach for deficit reduction in order to reasonably stem the growth of our national debt.
Because of these constraints, both candidates will likely have to adjust their plans, put all areas of the budget and tax code on the table, and pursue an “all of the above” approach for deficit reduction in order to reasonably stem the growth of our national debt.
Importantly and encouragingly, both Clinton and Trump appear to understand the importance of fiscal responsibility and dealing with our national debt. As the campaign continues, we hope that their policies will become more reflective of this understanding. We also look forward to working with the next president to develop deficit-reducing tax reform, entitlement reforms, and spending changes necessary to put the budget and economy on a stronger long-term path.
Read the full report.
Additional Readings:
- Scoring Clinton and Trump with Different Growth Assumptions
- Chartbook: Promises and Price Tags
- Adding Up Senator Sanders's Campaign Proposals So Far
Disclaimer: Fiscal FactCheck is designed to inform the public and is not intended to express a view for or against any candidate or any specific policy proposal. Candidates’ proposals should be evaluated on a broad array of policy perspectives, including but certainly not limited to their approaches on deficits and debt.
*This number has been corrected since publication.


