How Fast Can America Grow?
Official projections show real economic growth will average less than 2 percent annually over the next decade. However, some policymakers have suggested economic growth could be restored to its historic average of above 3 percent per year or even increased to 4 percent or more per year.
Faster growth would be a welcome boon for the economy, the federal budget, and household incomes; policymakers should pursue a growth-oriented agenda. Yet, while policymakers should aspire to and work toward faster growth, it is important that they do not overpromise or assume it prematurely.
In the context of an aging population, achieving rapid economic growth represents a major challenge. In this paper, we explain that:
- Economic growth is projected to be 1.8 percent over the next decade, which is more than a percentage point below historic levels. This is a reasonable assumption due to a slowdown in the growth of labor, capital, and productivity.
- The aging population is the biggest driver of slower growth. It is responsible for three-quarters of the decline in projected labor force participation and may also be partially responsible for a slowdown in capital and productivity growth.
- While it may be possible to temporarily boost economic growth through demand-side “stimulus,” there is no plausible path to sustained 4 percent growth.
- Even achieving sustained 3 percent growth – a worthy aspirational goal – would be quite challenging. There is little precedent to suggest labor, capital, or productivity growth alone will be enough to generate 3 percent economic growth.
- To grow the economy by 3 percent annually, productivity growth, capital growth, and prime-age labor force participation would all need to return to the levels of the booming 1990s – an unlikely scenario given recent trends.
The reality is that even getting part of the way to 3 percent sustained economic growth – which policymakers should certainly work to do – will likely require an aggressive and bold combination of pro-growth policies to boost productivity, labor, and capital along with a significant amount of luck.
For that reason that policymakers should pursue a growth agenda, which could include tax, entitlement, regulatory, public investment, and immigration reforms. Many of the ideas we have outlined here could make a significant difference in lifting the growth rate above projected levels.
Given the many benefits of faster growth, policymakers should work together on a plan to expand the economy. However, they should not make false promises about growth rates, and they certainly should not use these promises to justify new deficit-increasing policies that could ultimately hurt the nation’s growth prospects.
Keep reading, or jump to a section below:
- How Much Growth Should We Expect?
- How Much Sustained Growth Can Be Achieved?
- Can the Economy Grow Faster in the Short-Term?
- What Policies Can Increase Growth, and By How Much?
- Conclusion
- Appendix I: What Drives Economic Growth?
- Appendix II: Methodology
How Much Growth Should We Expect?
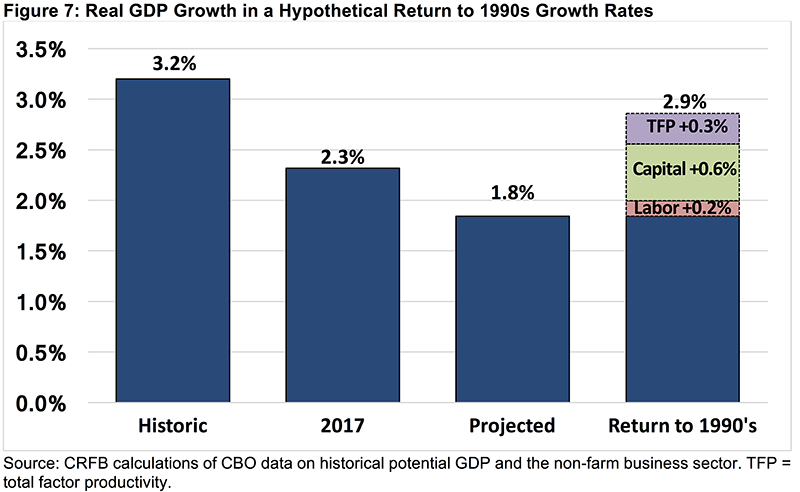
Since 1950, the U.S. economy has grown by about 3.2 percent per year (based on real Gross Domestic Product growth). Unfortunately, much slower growth rates are projected in the future.
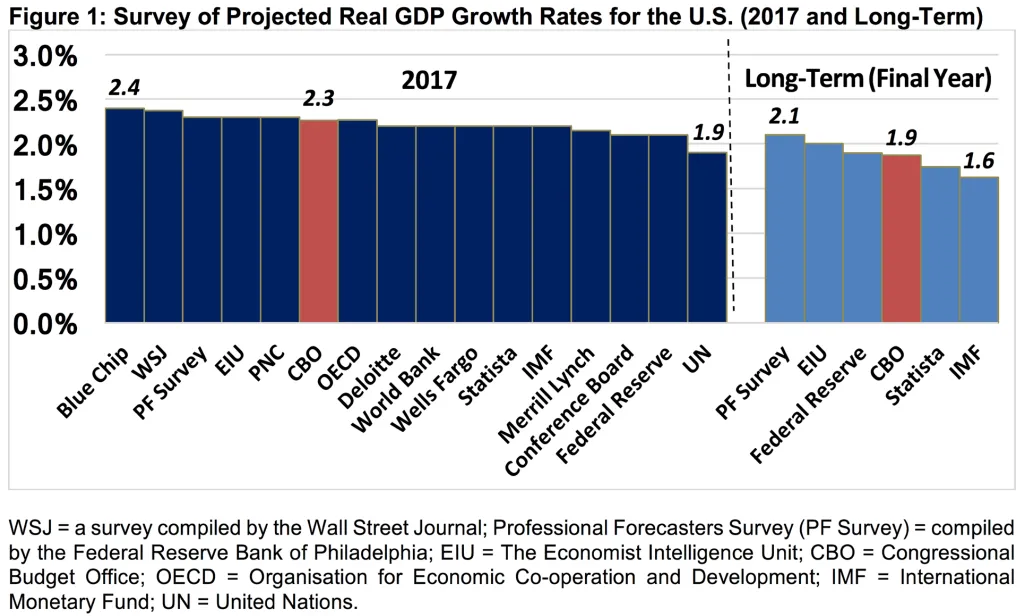
The nonpartisan Congressional Budget Office (CBO) estimates the economy will grow by 2.3 percent in 2017 and 1.8 percent per year on average over the subsequent decade (1.9 percent in 2027). Other forecasters have similar projections about future growth, with prominent estimates ranging from 1.9 to 2.4 percent growth forecasted this year and 1.6 to 2.1 percent growth forecasted over the long run.
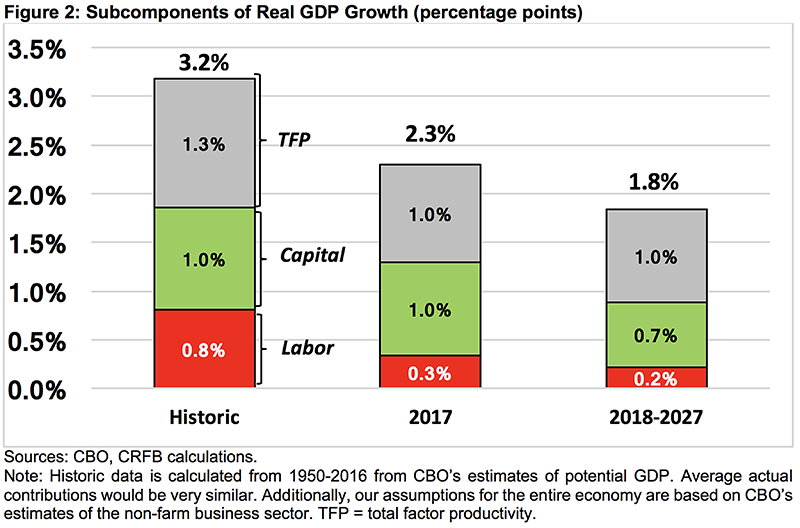
The difference between historic and projected growth is driven by slower growth of labor (hours worked), capital (machinery, buildings, and software), and total factor productivity (the skills and technology that increase output per worker and unit of capital).
Using CBO’s non-farm business sector data as a guidepost to estimate the effects of production factors on the entire economy,1 we find that both capital and productivity are projected to contribute roughly three-quarters as much as their post-1950 historic average to total growth. This reduction is significant but to some degree overshadowed by slower labor force growth – which is projected to contribute only one-quarter of what it has historically to growth.
Driving this decline in labor force growth is the aging of the population.2 Those over age 55 represent 36 percent of adults today and will represent 39 percent by 2030 compared to just 28 percent back in 1960 and 1990. Meanwhile, birth rates remain at about two children per woman. The result is a continued growth in the population but very little growth in the number of workers. Other factors also contribute to slow labor force growth.3
Since capital and labor serve as complements in the economy, the effects of population aging may also be contributing to reduced capital growth.
Aging might be responsible for slower capital growth in two other ways. Savings and investment – the sources of capital generation – tend to decline in an aging society as older individuals withdraw from retirement accounts rather than contribute to them. Meanwhile, the aging of the population is projected to balloon the costs of Social Security and Medicare, leading to higher federal debt that will tend to crowd out private investment over time.
Finally, there is some evidence that population aging may be a factor in the recent productivity slowdown. Researchers from RAND found that population aging leads to productivity declines in each age group, which might create a spillover loss to younger workers as older, more-productive workers retire. They estimated this effect has reduced productivity growth by 15 percent (0.2 percentage points).4
With an aging population, achieving historic levels of growth will become increasingly difficult. The 4.3 percent growth of the 1960s coincided with the large baby-boom population entering the workforce; the 3.5 percent growth of the 1990s coincided with them reaching their prime earning and productivity years. Now the baby-boomers are joining the ranks of the retired population, and the result is a significant economic slowdown. Thus, CBO’s estimate of 1.8 percent growth over the next decade is quite reasonable.
How Much Sustained Growth Can Be Achieved?
While 1.8 percent sustained growth is a reasonable estimate for what will occur over the next decade under current law, there is opportunity to pursue pro-growth policies to increase this growth rate. Good luck, perhaps in the form of unexpected technological advancement, may also lead to higher rates of growth.
However, there is no plausible path to achieve 4 percent sustained annual growth in light of current demographics, and even 3 percent growth is unlikely.
Recessions and booms can lead growth rates to vary dramatically from quarter to quarter, but over the long term, the economy should tend toward its productive potential – which is driven by changes in labor, capital, and productivity.
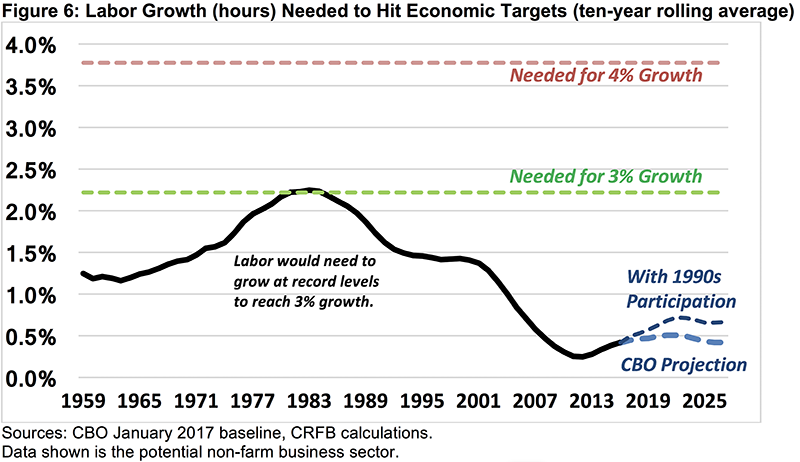
We estimate that achieving 3 percent growth would require either exceeding the record levels of productivity set between 1959 and 1968 or restoring capital growth, productivity growth, and labor force participation to the levels achieved in the booming 1990s. Either scenario would be a break from current trends.

Boosting Productivity
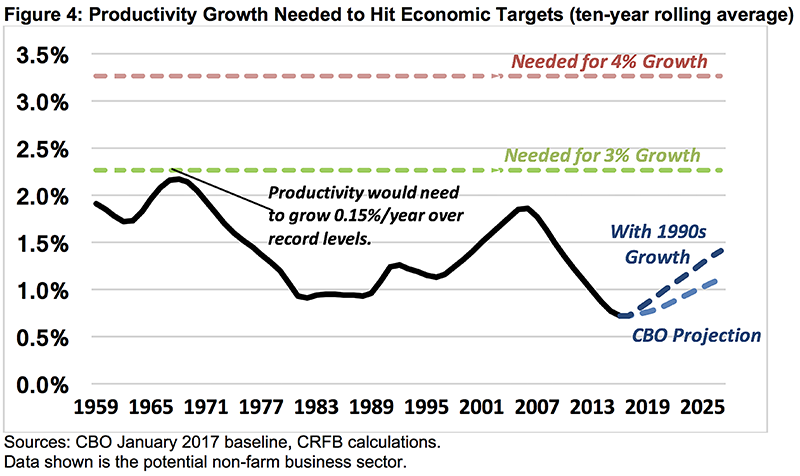
Based on CBO’s projections, we estimate economy-wide total factor productivity will grow about 1 percent annually over the next decade, which is lower than the historic average but roughly at the pre-recession level.
In order for the economy to grow at a sustained annual rate of 4 percent entirely through productivity increases, productivity growth would need to nearly triple. Even achieving 3 percent growth through productivity increases alone would require productivity growth to more than double current projections to a level of productivity growth that has never been sustained over any decade in modern history. The closest the country came was between 1958 and 1967 in the final wave of an ongoing trend in electrification, consumer appliances, and completion of the highway transportation system.
If total factor productivity growth were to rise to its average growth during the 1990s, it would achieve about one-quarter of what is necessary to achieve 3 percent real economic growth and only a small fraction of what is needed to achieve 4 percent growth.
Still, improving productivity growth is hugely important for the country’s economic future – and policymakers have several policies available that could help increase productivity by both increasing available technology and the skills of the workforce. To improve available technology, policymakers could increase spending on research and development, offer tax incentives for innovation, provide loans or loan guarantees for the development of new technologies, improve the patent system, and/or reform regulations that might be hurting innovation.
To improve skills of the workforce, policymakers could improve the quality of, and participation in, education; expand worker training and lifelong learning programs; promote apprenticeships; and/or increase high-skilled immigration.
Increasing Capital Investment
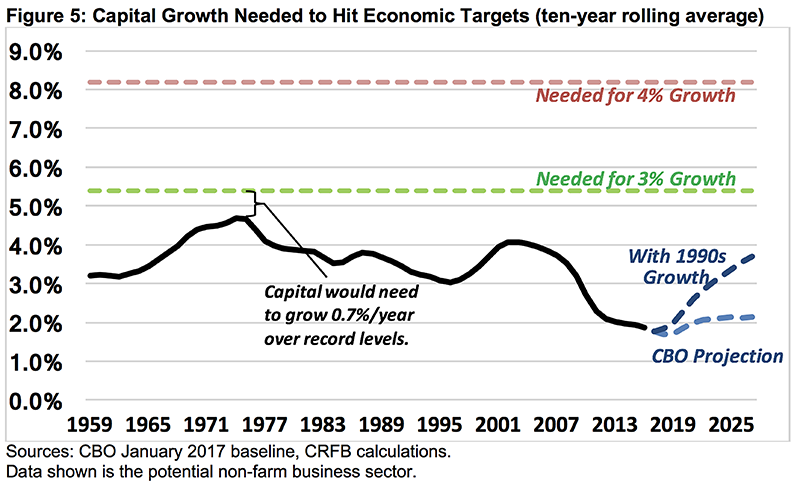
Based on CBO’s projections, we estimate capital in the full economy will grow by about 1.8 percent per year over the next decade (contributing 0.7 percent to real GDP growth). That number is significantly lower than its average since 1950 but similar to potential capital growth rates since the mid-2000s (actual capital growth was lower during that period due to the recession).
We estimate that in order for the economy to grow at a sustained annual rate of 4 percent solely by growing capital investments, capital would need to grow at almost quadruple current projections. Even to achieve 3 percent sustained growth, capital would have to grow at double current projections and well above the record for sustained capital growth (set between 1965 and 1974).
Given the falling capital growth rate, however, policymakers should work to accelerate capital growth where possible. One option would be to pursue tax reform, with a particular focus on business tax reform meant to spur capital investments. Entitlement reforms designed to increase individual savings could also help to spur private investment. In addition, shifting the budget’s focus from consumption to investment – particularly in public infrastructure – can boost publicly-owned capital.
Boosting capital growth will also require managing our national debt. CBO estimates that every dollar increase in the budget deficit reduces investment by 33 cents. Given the $1.4 trillion budget deficit projected in 2027, the cost of borrowing on the economy may prove significant.
By reducing projected deficits and slowing the unsustainable growth of our post-war era record-high debt, policymakers can increase private investment and capital growth.
Growing the Labor Force
Based on CBO’s projections, we estimate labor, as measured by total hours worked in the economy, will grow by about 0.3 percent over the next decade, contributing 0.2 percent to annual growth. This is only one-quarter of its average since 1950.
There is no historical precedent of labor growth sufficient to grow the economy at 4 percent. For the economy to grow at a sustained annual rate of 3 percent solely by growing labor, the labor growth rate would need to hit the record sustained growth rate set between the mid-1970s and mid-1980s. Doing so would be close to impossible in light of the aging population and current levels of female participation in the workforce. The total number of able-bodied, non-working (or underemployed) adults is simply too small to make up the difference.
Even restoring prime-age labor force participation to its peak during the 1990s (phased in over five years) – a very difficult but theoretically attainable goal – would only produce one-seventh of the boost needed to achieve 3 percent growth and a tiny fraction of the boost needed to achieve 4 percent growth.5 Based on current trends, CBO and others actually expect labor force participation to shrink, not grow.
Policies that prevent labor force participation from shrinking and encourage workers to work more hours can help to offset some of the consequences of an aging population.
Options to increase labor force growth include: enacting tax reform to encourage work; increasing immigration; reforming entitlement programs and other policies to encourage delayed retirement; expanding vocational assistance programs; modifying means-tested and disability programs to support those who remain at or return to work; expanding the availability of child care for working parents; and reforming regulations that discourage hiring.
Increasing Labor, Capital, and Productivity
Unfortunately, there is no foreseeable path to achieving 3 percent (let alone 4 percent) sustained growth by focusing only on labor, capital, or productivity. However, a concerted effort to increase all three simultaneously could make a significant difference in terms of boosting growth.
Still, achieving 3 percent sustained growth would require a heroic combination of good policy and good luck, and 4 percent sustained growth would not likely be possible under any realistic circumstance.
By our estimates, returning capital growth, productivity growth, and prime-age labor force participation to where they were in the 1990s would result in 2.9 percent growth.
These estimates suggest 3 percent growth might be theoretically possible. However, it is hard to imagine a scenario where the economy could realistically replicate its performance in the 1990s. The 1990s featured a technologic revolution where widespread availability of the internet and personal computing led to huge one-time booms in productivity and capital investment. The 1990s also featured a baby-boom population at its working prime, a new era of globalization, low levels of federal debt, and a period of unusual American dominance given the fall of the Soviet Union and the end of the Cold War. Moreover, some of the growth from the 1990s turned out to be a “bubble” and thus contributed to slower growth in subsequent years.
The 1990s was a historic decade for economic activity, and there is little evidence it can be repeated – though certainly policymakers should do what they can to move toward 1990s-level growth. Importantly, even if we did, economic growth would remain below its post-1950 average. With an aging population, rapid growth is far more difficult than it was in the past.
Can the Economy Grow Faster in the Short-Term?
Economic growth can vary substantially from quarter to quarter and year to year. While growth has averaged 3.2 percent since 1950, annual economic growth has been as high as 8.7 percent (in 1950) and as low as -2.8 percent (in 2009). Growth fluctuates even more on a quarterly basis. The highest growth rates tend to come during an economic boom or during a recovery from a recession (as 1950’s rate was). Rarely are they sustained over extended periods.
While CBO projects the economy to grow by 2.3 percent in 2017, actual growth could differ. A survey of private forecasters suggests 2017 growth estimates as high as 2.4 percent and as low as 1.9 percent. Higher growth is also possible, but no widely-cited source is projecting such.
In the near term, changes in the economy are driven primarily by total spending – including consumption, investment, government purchases, and net exports (see Appendix I for more detail). As a result, government policies that significantly increase consumption or government purchases can temporarily increase growth.
For example, CBO estimated last year that increasing government spending by roughly $15 billion in 2016 would increase the size of the economy by 0.1 percent in that year.6 Similarly, the Tax Policy Center estimated last year that a $350 billion tax cut in 2017 would increase the size of the economy by 1 percent in that year.7
However, these policies would likely to lead to slower growth in future years.
During a recession, an injection of tax cuts or spending increases (“stimulus”) can help the economy recover to its potential. However, with the unemployment rate well below 5 percent, the economy is likely already operating near its potential. A major stimulus package would therefore bring output above potential levels, where it cannot remain for an extended period. Either inflation or Federal Reserve actions (or both) would likely slow growth in future years to bring the size of the economy back down to its potential levels.
In other words, any faster near-term growth generated through deficit-financed tax cuts or spending would likely be offset by slower growth in subsequent years.
Moreover, the increase in the national debt resulting from this stimulus could further slow economic growth and eventually reduce the size of the economy to below what it would have been without the stimulus. The borrowing that could support consumption in the near term would crowd out investment and thus slow capital growth in the long run.
Thought of another way, many of the policies that could boost near-term growth would do so simply by borrowing that growth – effectively with interest – from future years.
What Policies Can Increase Growth, and By How Much?
Public policy does not drive economic growth, but often it can help. CBO and others have found that a number of changes could increase growth rates modestly. We’ve recommended policymakers pursue a number of these policies here. Below is a discussion of their estimated impacts.
Immigration reform: Immigration reform has one of the largest estimated impacts on GDP growth because it would directly increase the size of the labor force. CBO estimated that the 2013 immigration bill, which would increase the population by about 3 percent after a decade, would increase the size of the economy by 3.3 percent after a decade or boost average growth in that period by just over 0.3 percent per year.
Tax Reform: By changing incentives to work, invest, save, and innovate, responsibly financed tax reform can play a major role in economic growth. Prior estimates have found that well-designed tax reform could boost the size of the economy by between 0.5 and 2.5 percent, translating to a 0.05 to 0.3 percentage point increase in the average annual growth rate. However, deficit-financed tax reform could ultimately harm growth.8
Deficit Reduction: Deficit reduction can reverse the unsustainable growth of the national debt, reducing the “crowd out” of investment and thus increasing the capital stock. We estimate from a CBO scenario that a $4 trillion deficit reduction package sufficient to put debt on a downward path could boost economic growth by about 0.1 percent per year.
Figure 8: Increase in Average Annual Growth Rate With Estimated Policy Shifts
| Policy Change | Boost in Annual Growth Rate | Estimated By |
|---|---|---|
| Enact immigration reform to increase number of workers | 0.3% | CBO |
| Reform the income tax code | 0.05% - 0.3% | JCT, Treasury |
| Increase the Social Security retirement ages by two years | 0.15% | CBO |
| Reduce deficits by $4 trillion over ten years | 0.1% | CBO |
| Expand energy production at level of shale boom* | 0.09% | CBO |
| Repeal the Affordable Care Act (“Obamacare”) | 0.08% | CBO |
| Ratify the Trans-Pacific Partnership | 0.01% | U.S. ITC |
| Increase public investment in infrastructure, education, and research by $400 billion | 0 - 0.01% | CBO |
Most of these estimates were for a given growth over a specified period (e.g., the economy would be 1 percent bigger after ten years). For comparison, we converted all to a compound annual average growth rate, generally using ten-year scores over the period when the policy was actually being implemented. *Shale boom indicates estimates of the effect of the ongoing boom in shale exploration (which are already included in the baseline). CBO = Congressional Budget Office; JCT = Joint Committee on Taxation; U.S. ITC = U.S. International Trade Commission.
Other Pro-Growth Policies: Other policies can also increase growth rates. Some examples include:
- Increasing the Social Security and Medicare retirement ages
- Repealing the Affordable Care Act (ACA or “Obamacare”)
- Ratifying the Trans-Pacific Partnership trade agreement (or equivalent)
- Increasing energy production to as much as the recent shale boom
- Increasing public investment in infrastructure, education, and research
- Certain regulatory reforms could also promote growth, though scorekeeping agencies have thus far provided few estimates on the economic impact of such reforms.
Importantly, most of the policies described here are worth pursuing even if they do not result in 3 percent growth. Even a small boost in average GDP growth can lead to significant improvement in people’s lives.
Yet it would be virtually impossible for all of these policies to be enacted simultaneously, given the timing windows of these policies and the finite resources available to fund tax reform, public investment, and deficit reduction .
Moreover, even if all of the changes described above somehow were enacted at the same time (assuming no interaction), average growth over the next decade will still remain below 3 percent per year.
This reinforces the ideas that achieving 3 percent annual growth on a sustained basis would be quite challenging and that 4 percent sustained growth is likely impossible.
This is especially true when one considers that many of the policies described above are not being actively discussed. Indeed, some policies currently under consideration would increase debt levels, cut public investment, restrict trade, and reduce net immigration; these changes could diminish long-term growth.
Conclusion
With the demographic headwinds from an aging population, 4 percent economic growth has virtually no chance of materializing over a sustained period of time, and promises of such growth are more likely to generate false hope than true resolve.
Three percent sustained economic growth, while a worthy aspirational goal, is also an incredibly challenging one. To achieve 3 percent growth on a sustained basis, the United States would effectively need to perform better than it did during the booming 1990s. Neither a stronger labor force nor an increasing growth in capital nor faster productivity alone would be enough to get to 3 percent growth – all three would be needed.
Achieving 3 percent growth would require a strong policy agenda along with a tremendous amount of luck, and therefore no one should assume this growth in their projections about our nation’s economic future.
Instead, policymakers should engage in the important work of pursuing as many pro-growth tax, spending, and regulatory policies as possible (see our ideas here). The focus should be on sustainable growth rather than quick fixes. And key to any growth strategy is a comprehensive fiscal agenda that puts the national debt on a sustainable path.
Setting an aspirational goal of 3 percent growth (while only counting on 1.8 percent) can succeed, even if the goal itself is not realized. If real economic growth were to average 2.5 percent per year over the next decade, for example, GDP would be $2 trillion (10 percent) larger after a decade, average annual income would be up to $5,000 higher, and the national debt would hold at its current level of 77 percent of GDP rather than rise to 89 percent.
Faster economic growth is incredibly important but also hard to come by. Sound data – not arbitrary assumptions – should drive decision-making. Policies should be designed with high hopes but reasonable expectations.
Appendix I: What Drives Economic Growth?
In order to understand the extent to which public policy can influence economic growth, it is first important to understand what factors are most responsible for economic growth. Under conventional economic theory, the answers for the short term and the long term are different. In the short term, conventional theory says that changes in the size of the economy are driven largely by “aggregate demand” – the total amount of spending in the economy. Over the long run, conventional theory says that changes in the size of the economy are driven by “aggregate supply” – the total amount of production of goods and services in the economy.
Short-term spending in the economy essentially drives aggregate demand. More specifically, in the near term, standard economic models believe output is determined by the sum of: all consumption of goods and services; investment in equipment, buildings, and software; government purchases; and net exports (exports minus imports). These factors are represented in the traditional equation Y = C + I + G + NX.
In the near term, policymakers can therefore boost economic growth by increasing government purchases or by enacting policies (for example, tax cuts or increases in transfers) to increase consumption. Policies that increase investment or exports would also boost growth.
When the economy is in recession or operating below potential, these changes can help reduce unemployment, accelerate growth, and help bring the economy back to pre-recession conditions. However, near-term policies to boost consumption or government purchases typically offer only a temporary boost in the size of the economy. Moreover, to the extent that such policies add to the national debt, they may slow long-term growth – especially if they are enacted when the economy is not in recession or below potential.
Over the long run, output will tend to return to an economy’s potential level as economies cannot ultimately be larger than their capacity to produce. Once at potential, long-term economic growth is driven largely by an economy’s factors of production – most significantly labor supply, physical capital, human capital, natural resources and technological knowledge/productivity. These factors are represented in the equation Y = A * f(L,K,H,N).
Often economists simplify this model to include only labor, physical capital, and productivity, counting human capital as a part of productivity.
Labor supply – the total number of hours worked in an economy over the course of a year – is driven by the number of working-age people as well as the number of hours they work. Policies to increase immigration, reduce disincentives to enter the labor force (or to work more hours), or encourage delayed retirement can all help to increase labor supply.
Physical capital – the total amount of equipment, buildings, software, and machinery in an economy – is driven by the amount of savings and investment in the economy. Policies to promote savings, encourage private capital investment, expand infrastructure, or reduce federal budget deficits can therefore all increase the growth of physical capital.
Total factor productivity – a measure of the efficiency and intensity of the use of the other factors of growth – is driven by available technology, advancement of production techniques, and (by some measures) the amount of skills (human capital) in the labor force. It is often measured as what is left over after measuring labor and capital’s contributions to the growth rate. Policies that increase innovation (or education or training, when human capital is incorporated) will also tend to increase total factor productivity.
Total potential economic growth (which should roughly equal actual economic growth over the long term) can be determined by measuring the growth of labor, capital, and total factor productivity. Productivity contributes fully to growth, meaning that if productivity grows 0.1 percent faster, total growth will as well. Labor and capital, on the other hand, are partial contributors. Every 0.1 percent increase in labor force growth adds about 0.07 percent to total growth. Meanwhile, every 0.1 percent increase in capital growth adds about 0.03 percent to total growth. A 0.1 percent increase in both labor and capital, like a 0.1 percent increase in productivity, would add 0.1 percent to total economic growth.
Appendix II: Methodology
Historical and projected estimates of the components of real GDP growth (labor, capital, and productivity growth) are based on data from CBO, available here and here.
Unfortunately, while our estimates are meant to reflect changes in real growth of the full economy, CBO’s data reflect only changes in potential GDP and only for the non-farm business sector.
To adjust from potential to real GDP growth for 2017 and on, we use CBO’s data for real non-farm GDP, labor, and total factor productivity growth from CBO’s long-term outlook. We impute capital growth based on that data. For historic data (1950-2016), we use CBO’s series on potential GDP, which includes labor (hours), capital, and total factor productivity growth for the non-farm business sector. Because we start and end the series when the economy is near potential, we view potential growth as a reasonable proxy for actual growth over very long periods of time (over 60 years). Thus when data is presented as historic it is of potential GDP and its components.
Our figures also adjust the component parts of GDP in CBO’s data to reflect the entire economy, which has historically (and under CBO’s projections will continue to) grown more slowly than the non-farm business sector. Given that the non-farm business sector represents nearly four-fifths of the economy, we made the simplifying assumption that the ratios of capital, labor, and productivity growth were the same for the whole economy as the non-farm business sector. In reality, these ratios may differ and thus our numbers could differ slightly from reality.
To estimate contributions to growth, we assume a standard Cobb-Douglas production function and convert inputs (Hours, Capital Services, Total Factor Productivity) into growth components. In this function, we assume total factor productivity is a full contributor to real GDP growth, while labor contributes roughly 65 percent and capital roughly 35 percent. Those percentages fluctuate somewhat in different time periods.
Economic growth and its component data are calendar year and come from CBO when available.
Whereas our analysis is based on rough estimates of real growth for the full economy, graphs for growth inputs (ten-year moving averages over time) use the non-farm business sector and potential GDP from CBO. This provides an apples-to-apples comparison for what we project will be needed to be done to reach a certain growth level. We apply our assumption that changes in labor, capital, and productivity affect the economy equally in our calculation of what those inputs would need to become to increase growth over ten years.
Importantly, our numbers should be viewed as a rough approximation of reality based on existing available data. The data is sufficiently firm to justify our conclusions but should not be used as a data source for further research without first contacting the authors.
1 As a simplifying assumption, we assume the relative weights of labor, capital, and productivity are the same for the entire economy as they are for the non-farm business sector. See Appendix II.
2 For instance, CBO expects the labor force participation rate would stay nearly constant if age and gender ratios did not change.
3 In particular, prior decades experienced significant labor force growth as a result of women entering the workforce, a trend that has slowed down considerably as labor force participation among women has begun to converge with that of men. In addition, among prime-age workers (25-54), labor force participation has fallen some – from a high of 84.6 percent in the late 1990s to 81.7 percent today. See also CBO, "The 2017 Long-Term Budget Outlook," p. 33, March 2017.
4 Maestas, Mullen, and Powell, "The Effect of Population Aging on Economic Growth, the Labor Force, and Productivity," July 2016.
5 In estimating prime-age labor force participation, we assume each age-gender group experiences the higher of their labor force participation rate in the 1990s or their rate under CBO’s projections.
6 CBO, "The Macroeconomic and Budgetary Effects of Federal Investment," June 2016.
7 Nunns, Burman, Page, Rohaly, and Rosenberg, Urban-Brookings Tax Policy Center, "An Analysis of Donald Trump's Revised Tax Plan," October 2016.
8 Burman, Nunns, Page, Rohaly, and Rosenberg, "An Analysis of the House GOP Tax Plan," Columbia Journal of Tax Law, Vol 8:257, April 2017.