FY 2015 Deficit Falls to $439 Billion, but Debt Continues to Rise

This paper was updated on October 15, 2015 to reflect the final end of year deficit as announced by the Treasury Department.
The Fiscal Year (FY) 2015 budget deficit totaled $439 billion, according to today’s statement from the Treasury Department. Although this is roughly 10 percent below the FY 2014 deficit and nearly 70 percent below its 2009 peak, the country remains on an unsustainable fiscal path.
In this paper, we show:
- Annual deficits have fallen substantially over the past six years, largely due to rapid increases in revenue (largely from the economic recovery), the reversal of one-time spending during the financial crisis, small decreases in defense spending, and slow growth in other areas.
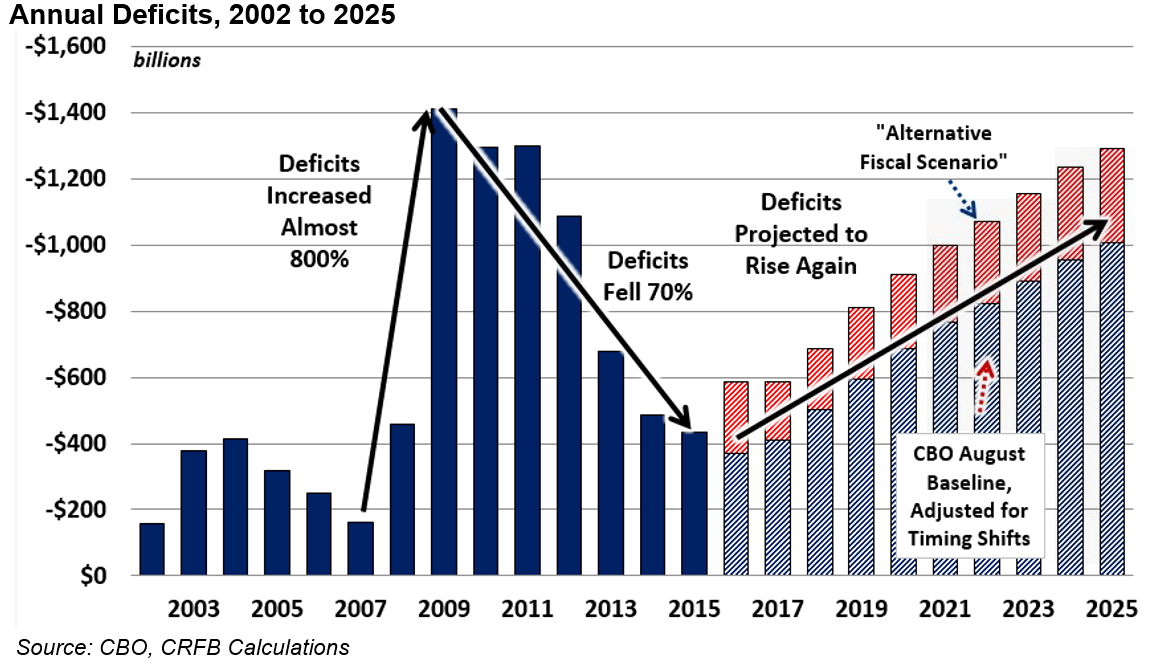
- Simply citing the 70 percent fall in deficits over the past six years without context is misleading, since it follows an almost 800 percent increase that brought deficits to record-high levels.
- Even as deficits have fallen, debt held by the public has continued to rise, growing from $5.0 trillion in 2007 and $7.5 trillion in 2009 to $13.1 trillion today. As a share of GDP, debt rose from 35 percent in 2007 to about 74 percent in 2014 and 2015.
- Both deficits and debt are projected to rise over the next decade and beyond, with trillion-dollar deficits returning by 2025 or sooner and debt exceeding the size of the economy before 2040, and as soon as 2031.
Unfortunately, the recent fall in deficits is not a sign of fiscal sustainability.
The Deficit in FY 2015
According to the Treasury Department, the federal deficit totaled $439 billion in FY 2015 (an initial report from the Congressional Budget Office on October 7th estimated the deficit at $435 billion), with $3.25 trillion of revenue, $3.69 trillion of spending.
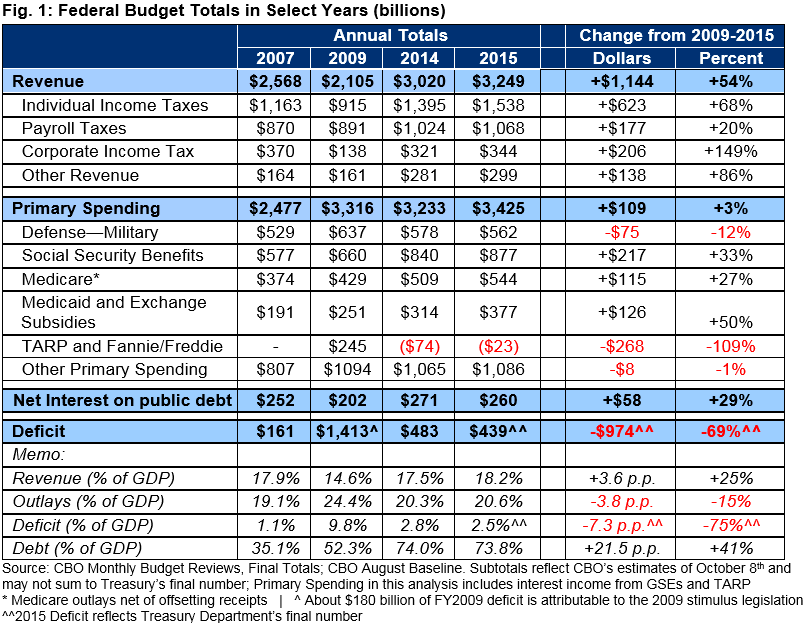
Since 2009, the budget picture has changed significantly, with deficits falling by 70 percent, from $1.4 trillion to $439 billion. This reduction was driven mainly by the 54 percent ($1.1 trillion) increase in tax collections that has come largely as a result of the economic recovery but also due to real tax bracket creep, new taxes from the American Taxpayer Relief Act, the Affordable Care Act, and increased remittances from the Federal Reserve.
At the same time, nominal spending is only slightly higher than in 2009, even as the economy has grown, and inflation has eroded the value of this spending. Indeed, nominal spending has decreased in a number of areas, particularly due to the absence and reversal of financial rescue and economic recovery programs through the Troubled Asset Relief Program (TARP), the rescue of Fannie Mae and Freddie Mac, and the expiration of stimulus spending. Defense spending has also fallen as a result of the drawdown in war spending along with spending caps (further reduced under “sequestration”) on base defense spending. Meanwhile, non-defense discretionary spending has remained relatively flat in nominal terms since 2009, while Medicare, non-ACA Medicaid, and interest costs have all grown slowly relative to their historical trends.
With spending growing at a relatively slow pace, revenue has largely caught up – leading to a substantial reduction in deficits between 2009 and 2015. However, at $439 billion (2.5 percent of GDP), the deficit in 2015 was still significantly higher than the pre-recession deficit of $161 billion (1.1 percent of GDP) in 2007.
Deficits Fell From Record Levels, And They Will Rise Again
A 70 percent drop in annual deficits since 2009 is certainly significant, but it is less impressive than some would suggest when put in context. The rapid fall was from record-high levels and followed an even more rapid increase. At $1.4 trillion, the 2009 deficit was the highest ever in both real and nominal dollars, and the largest as a share of the economy except during World War II. The 2009 deficits represented a 779 percent increase from 2007 – only two years earlier.
While legislated spending reductions, tax increases, and other factors have played a role in reducing deficits from since 2009, the end of trillion-dollar deficits was largely the expected result of the recovering economy and the fading of measures intended to boost the recovery. As unemployment rates have fallen and GDP risen, revenue collection has returned to more normal levels and countercyclical spending has subsided in areas such as unemployment insurance and food stamps. Meanwhile, stimulus and financial rescue measures enacted to speed the recovery have mostly ended and are in some cases now generating income for the government.
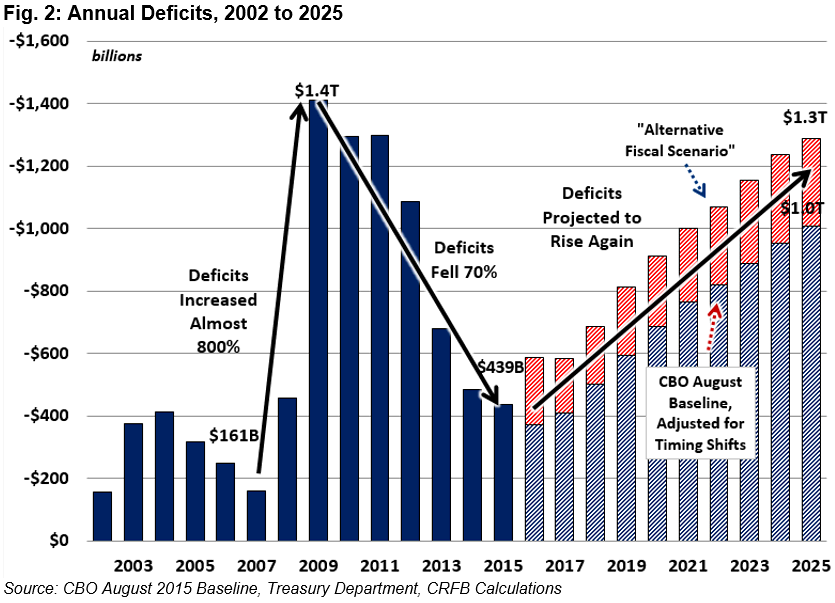
Unfortunately, even with these gains, the deficit remains about 270 percent as high as in 2007 (1.4 percentage points higher as a percent of GDP) and is projected to grow over time. Under CBO’s current law baseline, annual deficits will return to trillion-dollar levels by 2025. In 2016 deficits are projected to fall slightly however the likely continuation of tax extenders – even if only retroactively – means deficits will almost certainly rise that year. Under the more pessimistic Alternative Fiscal Scenario in which policymakers fail to pay for new spending and tax cuts, the deficit will reach $1.3 trillion in 2025, rapidly approaching the nominal-dollar record set in 2009.
As Deficits Fall, the Debt Keeps Rising
Arguably the most important metric of a country’s fiscal health is its debt-to-GDP ratio. And unfortunately, even as deficits have fallen the last six years, debt has grown. Indeed, over the same period that deficits fell by 70 percent, nominal debt held by the public grew by about 75 percent – from $7.5 trillion to $13.1 trillion. As a percent of GDP, debt has also grown rapidly, from 35 percent of GDP in 2007 to 52 percent of in 2009 and nearly 74 percent in 2015. This puts debt at just under twice the 50-year historical average of 38 percent of GDP, and leaves it near record-high levels never seen other than around World War II.
Falling deficits have not prevented the debt from growing; rather, they have only slowed down the growth trend. While the debt-to-GDP ratio was essentially stable between 2014 and 2015 and may remain so for the next few years, debt is projected to continue growing faster than the economy over the long run. As the population ages, health care costs grow, and interest rates rise to more normal levels, CBO projects debt will rise from 73 percent of GDP in 2018 to 77 percent of GDP by 2025, and will exceed the size of the economy before 2040. Under CBO’s Alternative Fiscal Scenario (AFS), debt will exceed the size of the economy by 2031.
Conclusion
The fact that deficits have fallen from their trillion-plus dollar levels is encouraging, but more a sign of the economic recovery than enacted deficit reduction. And unfortunately, Washington’s myopic focus on near-term deficits has led to savings which will do little to alter the trajectory of our growing debt.
The significant decline in the deficit followed a massive increase in response to the economic crisis. Moreover, this decline does not suggest the country is on a sustainable fiscal path as debt levels are near historic highs and are projected to grow unsustainably over the long run. In only a decade, deficits are projected to again exceed $1 trillion, and within 15 to 25 years debt is projected to exceed the entire size of the economy.
Policymakers must work together on serious tax and entitlement reforms to put debt on a clear downward path relative to the economy, and should not declare false victories while sweeping the debt issue under the rug.
Download a printer-friendly version of the paper here.
This paper was updated on October 15, 2015 to reflect the final end of year deficit as announced by the Treasury Department. In addition, the paper is an update of “Deficit Falls to $483 Billion, but Debt Continues to Rise” from October 2014
What's Next
-

-
-
Image