CBO’s January 2017 Budget and Economic Outlook
As President Trump enters his first full week in office, new Congressional Budget Office (CBO) projections show that he faces an unsustainable fiscal path.
President Trump enters office with debt held by the public as a share of Gross Domestic Product (GDP) higher than at the start of any presidency other than Truman’s. And according to CBO’s Budget and Economic Outlook, debt under current law is projected to continue to rise unsustainably in future years.
Specifically, the report shows that under CBO’s current law baseline:
- Trillion-dollar deficits will return by Fiscal Year (FY) 2023, with deficits growing from $587 billion (3.2 percent of GDP) in 2016 to $1.4 trillion (5.0 percent of GDP) by 2027.
- Debt held by the public will rise by $10.7 trillion between 2016 and 2027, from $14.2 trillion to $24.9 trillion. As a share of GDP, debt will rise from a post-WWII era record-high of 77 percent in 2016 to 89 percent by 2027.
- Debt will continue to grow over the long term, reaching its war-time record by 2035 and totaling 145 percent of GDP in three decades.
- Deficit projections are nearly identical to those in August, though debt represents a slightly higher share of the economy throughout the decade.
- Growing deficits are the result of rapid growth in entitlement and interest spending combined with revenue growing just a bit faster than the economy. CBO projects annual spending will rise by $2.6 trillion between 2017 and 2027, with 70 percent of that growth from Social Security, Medicare, and interest.
- Real economic growth is projected to average 1.9 percent over the next ten years, about half the growth rate targeted by the new administration.
- The budget outlook could be even worse than projected if lawmakers continue to pass legislation without offsetting its costs. For example, if lawmakers pass full sequester relief, continue tax extenders, and repeal certain ACA taxes without offsets, debt would rise to 96 percent of GDP (rather than 89 percent) by 2027.
The CBO outlook serves as a sobering reminder of the challenging fiscal situation President Trump and the new Congress will face. Deficits are projected to increase significantly over the next decade, and the debt is projected to reach its fourth-highest level in history by 2027 (with the three highest all a result of World War II). Hopefully, this projection will serve as a wake-up call for serious action on entitlement and tax reform that puts debt on a sustainable downward path.
Spending, Revenue, Deficits, and Debt
After deficits increased in 2016 for the first time since the aftermath of the Great Recession, CBO projects that they will slightly decrease in 2017 and 2018 before continuing to grow over the rest of the decade.
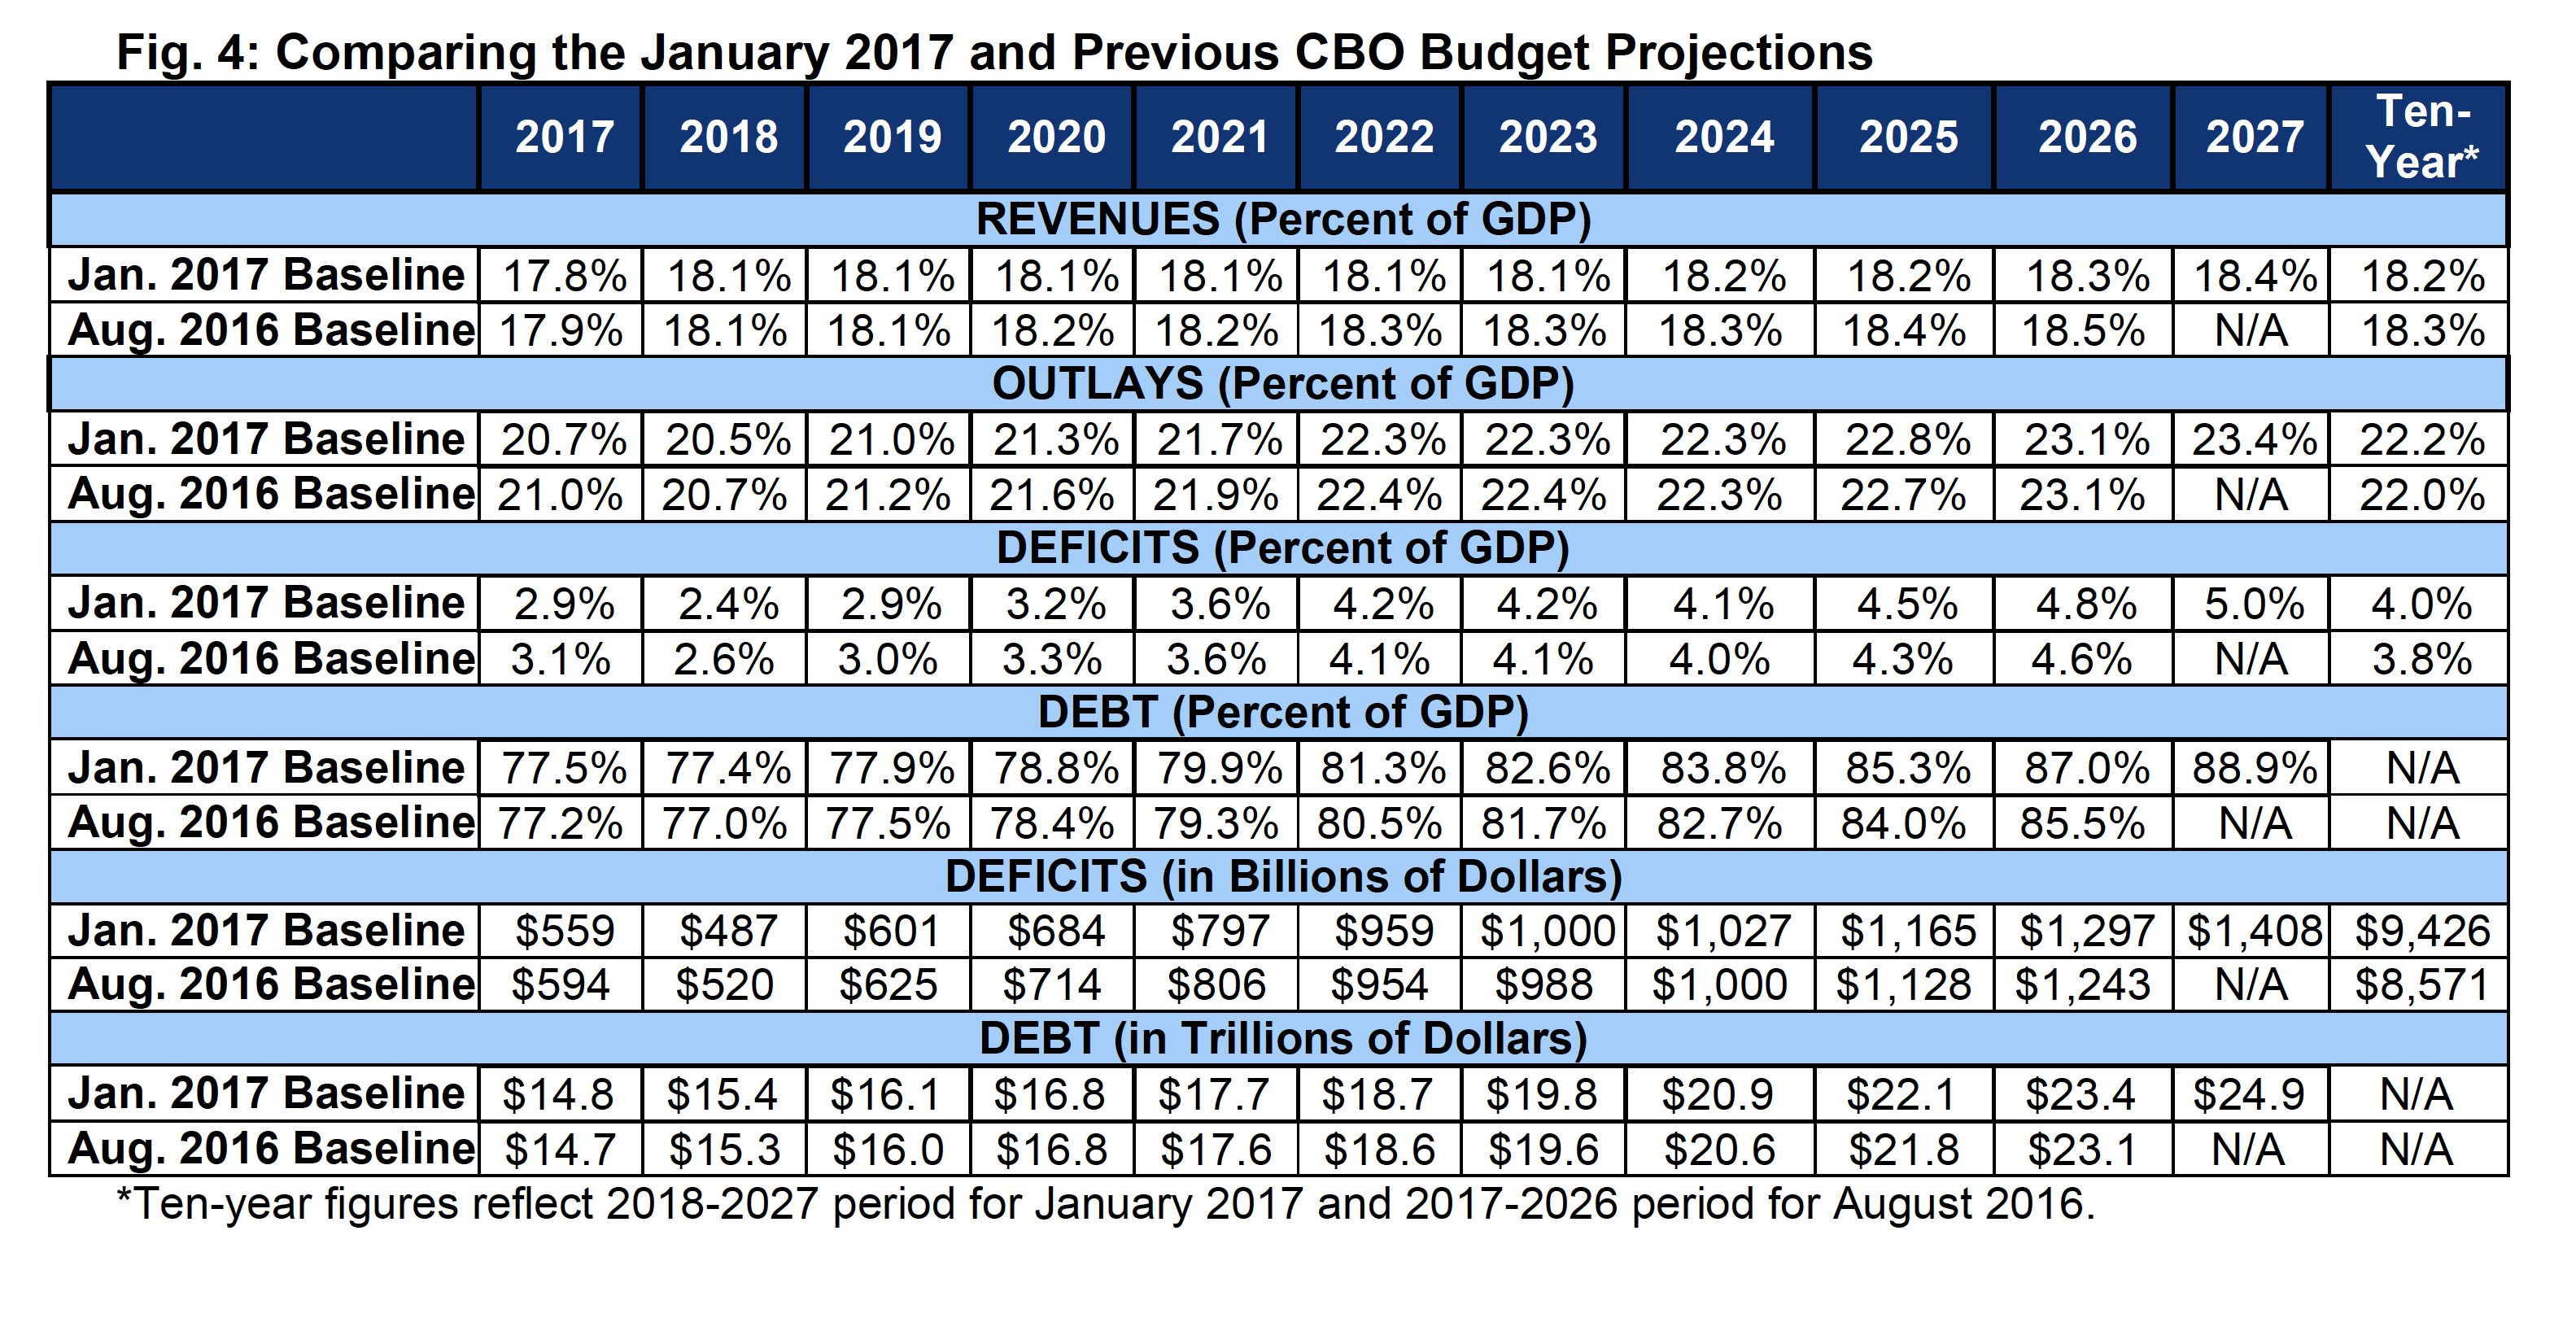
According to CBO, the deficit will slightly dip from $587 billion (3.2 percent of GDP) in 2016 to $559 billion in 2017 (2.9 percent of GDP) and $487 billion (2.4 percent of GDP) in 2018, but then rise continuously thereafter. Annual deficits will reach $1 trillion (4.2 percent) by 2023 and $1.4 trillion (5.0 percent) by 2027 – only a few billion away from the nominal record set in 2009. As a share of GDP, the deficit in 2027 will represent the sixth-largest shortfall since just after World War II.

These deficits will drive the growth of debt even farther above its already high level. CBO projects debt held by the public will rise dramatically, from $14.2 trillion at the end of 2016 to $24.9 trillion by the end of 2027 – a $10.7 trillion increase. As a share of the economy, debt will rise from 77 percent of GDP in 2016 – more than twice what it was in 2007 – to 89 percent by 2027. Debt will therefore be more than double its 50-year historical average of less than 40 percent and will continue to set post-WWII era records every year in the future.
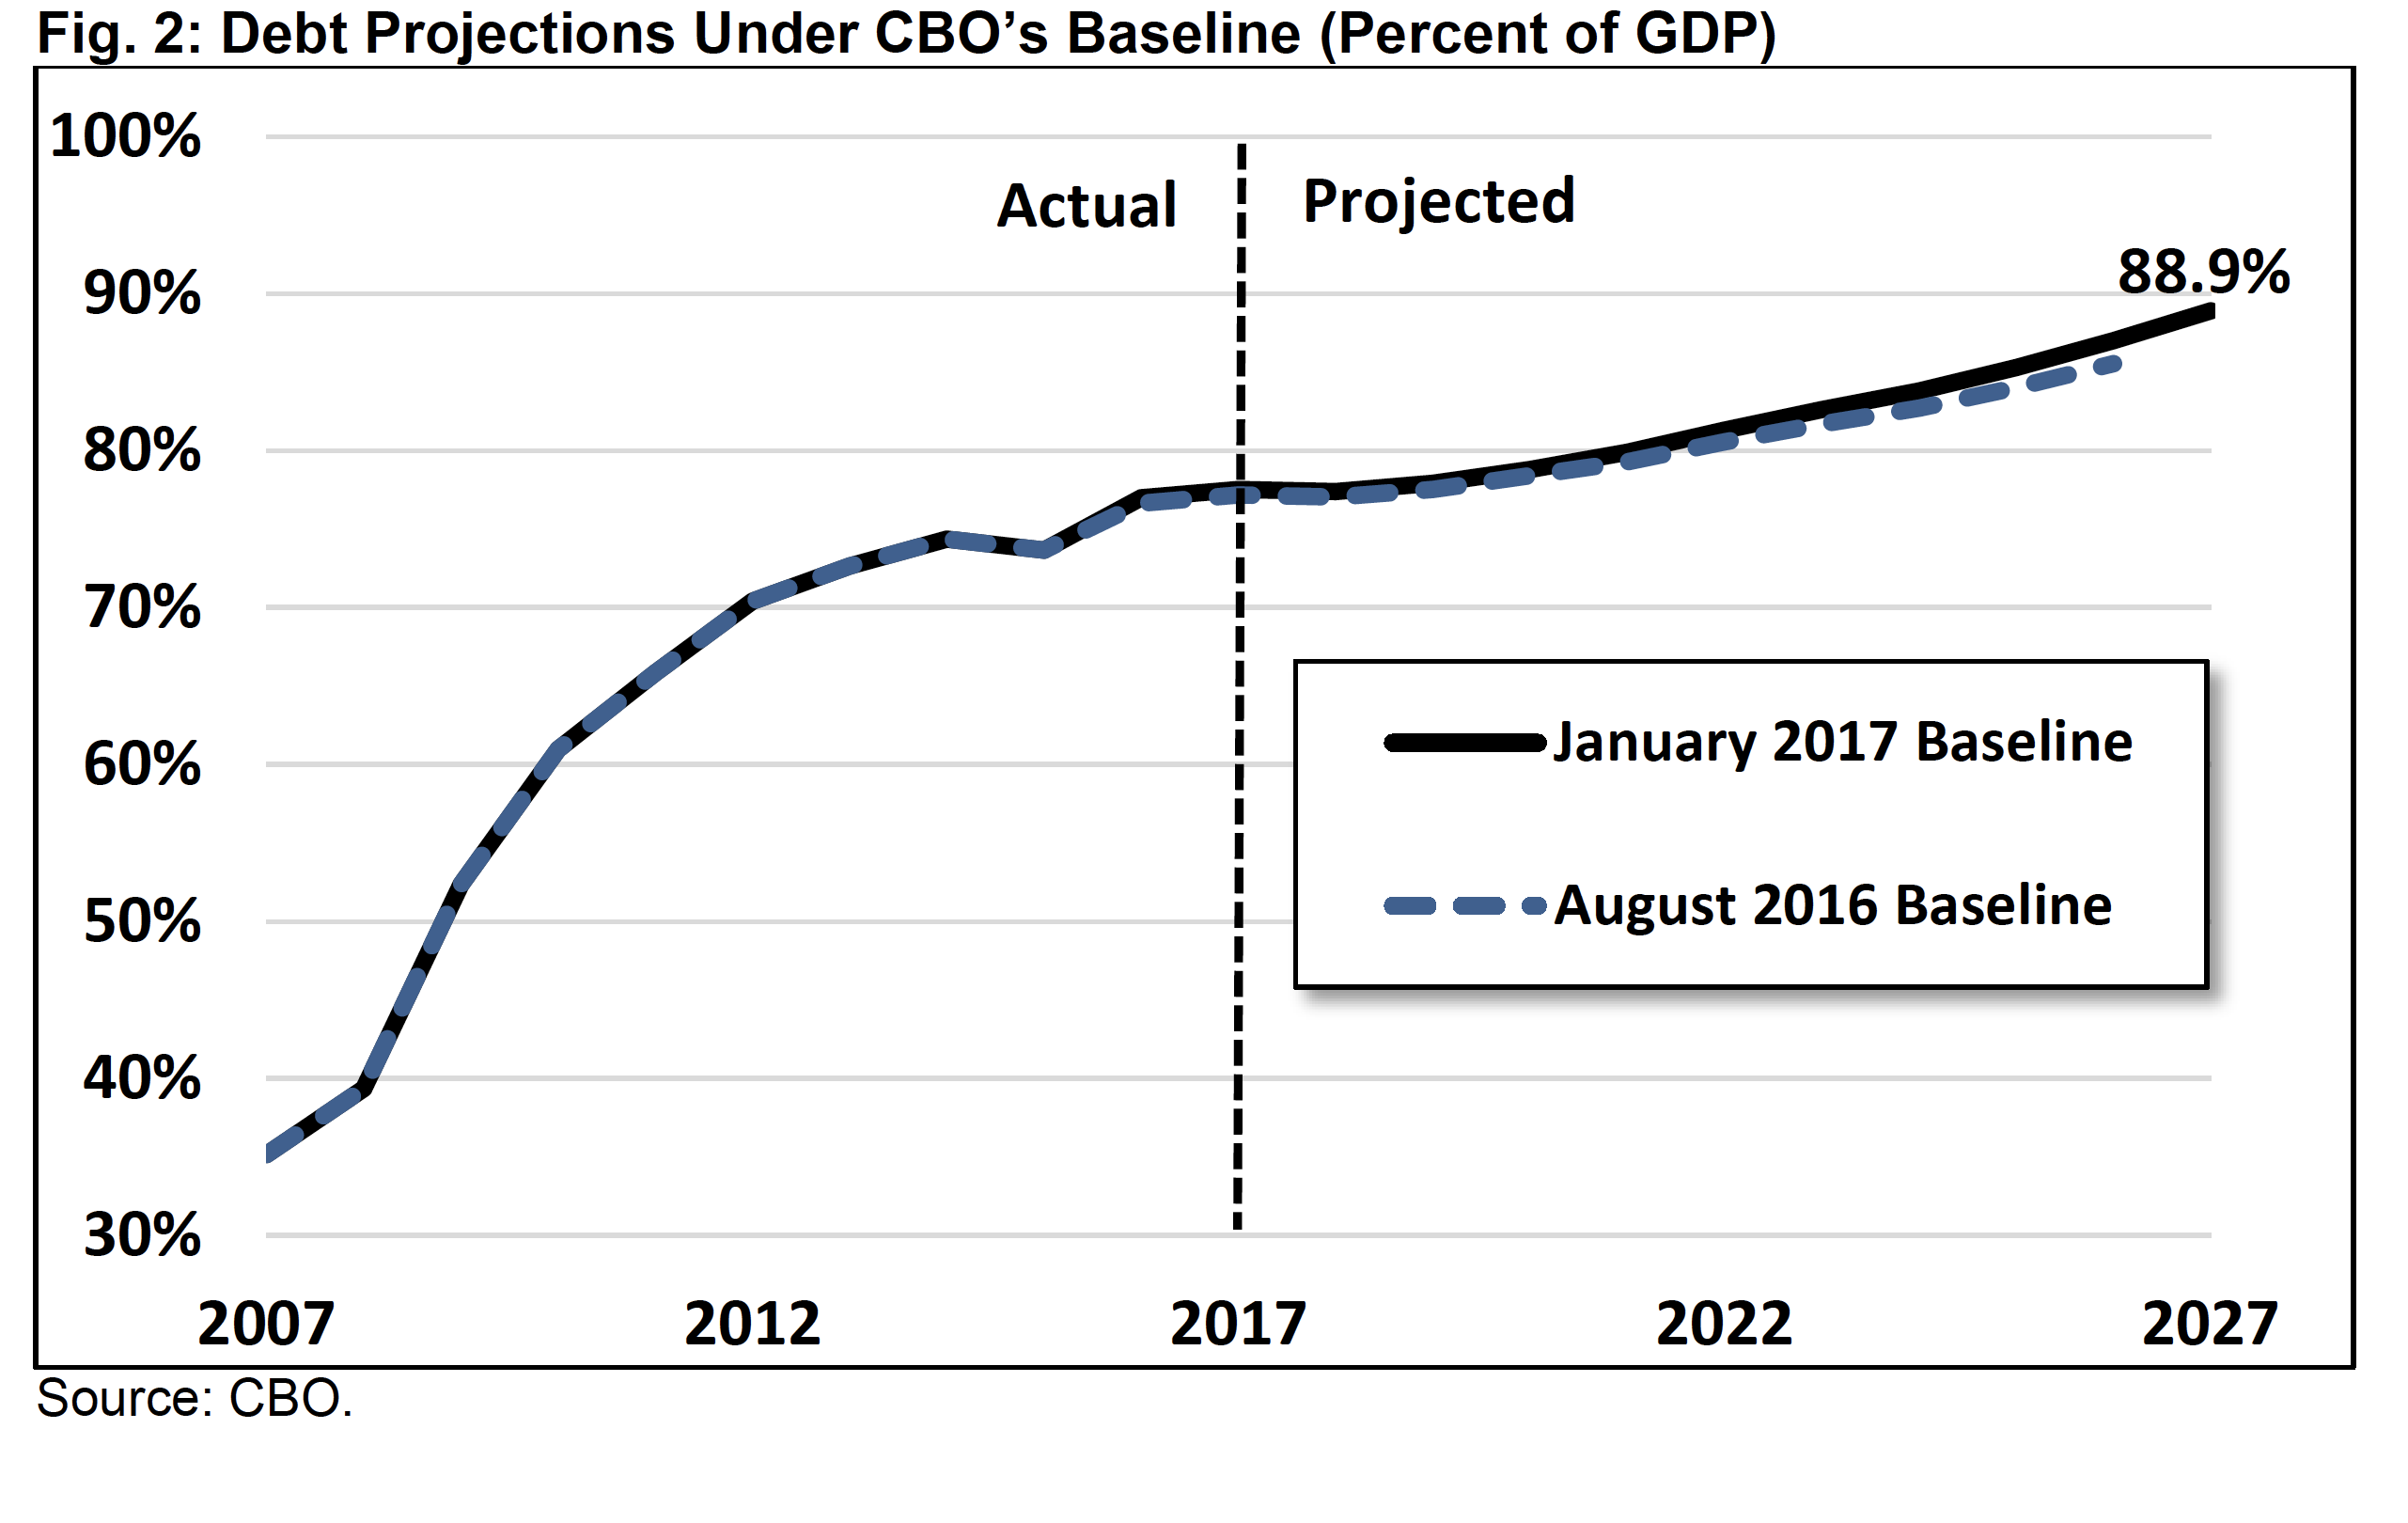
Beyond 2027, debt is projected to continue to grow and eventually surpass the all-time record of 106 percent of GDP by 2035. Without policy action, debt will reach 145 percent of GDP by 2047.
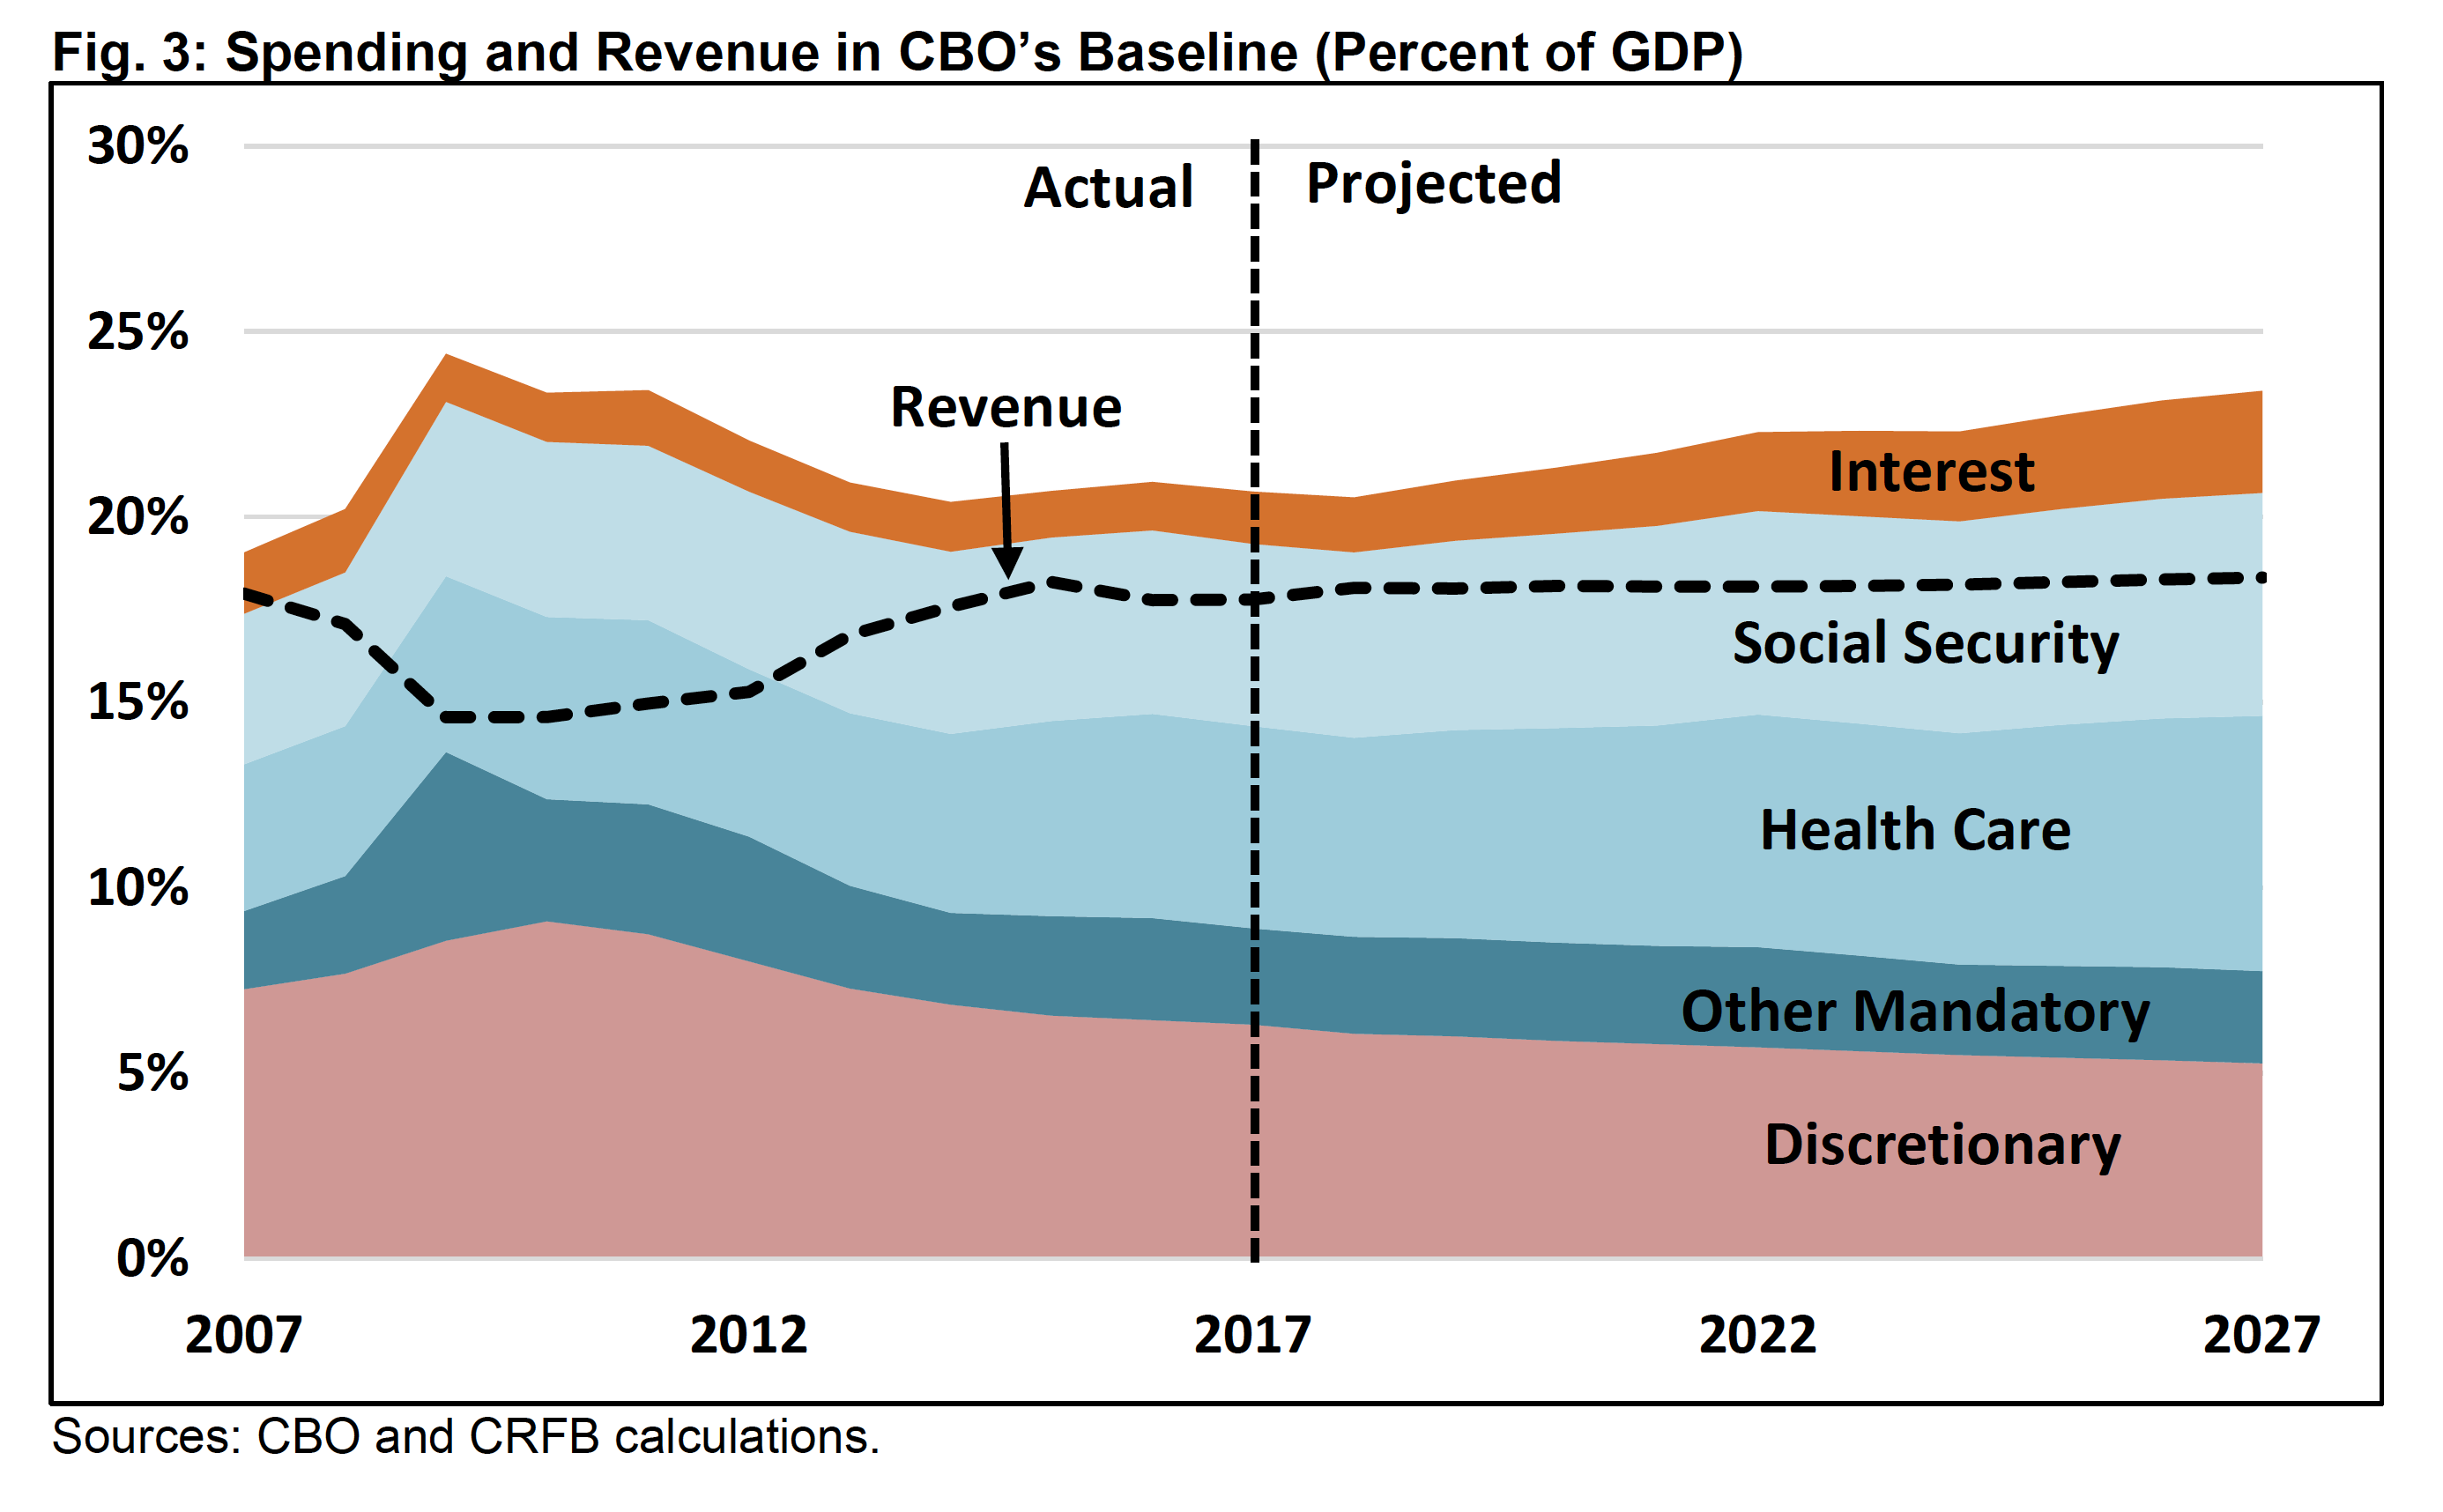
The growth in deficits beyond 2018 is the result of growing spending and relatively stagnant revenue. CBO estimates spending will grow from 20.9 percent of GDP in 2016 to 23.4 percent in 2027, much higher than the 50-year historical average of 20.2 percent.
This spending growth is largely the result of an aging population, rising health care costs, and rising interest rates. In fact, CBO projects that Social Security, Medicare, and net interest on the debt will be responsible for 70 percent of the $2.6 trillion growth in annual spending between 2017 and 2027; growth in other health spending will be responsible for about 12 percent. This means that growth in all other areas of the government – including defense spending, welfare, food stamps, education, federal employment, farm subsidies, foreign aid, and others – are responsible for less than a fifth of the nominal growth in spending.
As a share of GDP, this trend is even more pronounced, with combined increases in Social Security, health spending, and interest larger than the total spending increase. Specifically, while total spending will grow by 2.7 percent of GDP between 2017 and 2027, Social Security will grow by 1.1 percent of GDP, health spending by 1.4 percent of GDP, and interest – the fastest growing part of the budget – will grow by 1.3 percent of GDP. All other spending will actually shrink as a share of the economy by a combined 1.2 percent of GDP.
Revenue, meanwhile, will rise only slightly as a share of the economy over the next decade from its current level of 17.8 percent of GDP in 2016 and 2017 to 18.1 percent from 2018 through 2023 and 18.4 percent by 2027. While individual income tax revenue will rise from 8.4 percent of GDP in 2016 to 9.7 percent by 2027, other sources of revenue will fall from 9.4 percent in 2016 to 8.7 percent by 2027. Overall, revenue will be modestly above the 50-year historical average of 17.4 percent of GDP.
Compared to the most recent baseline update in August 2016, the budget outlook is mostly unchanged in both nominal dollars and as a share of the economy. For example, debt in 2026 is projected to reach $23.4 trillion or 87.0 percent of GDP under current projections, compared to $23.1 trillion and 85.5 percent of GDP in CBO’s August projections.
These projections are based on CBO’s current law baseline, which assumes Congress and the president do not enact deficit-financed tax or spending packages. Were Congress to cancel future spending reductions from “sequestration,” continue temporary tax breaks, and repeal or continue postponing certain delayed ACA taxes, an additional $2 trillion could be added to the debt by 2027. As a result, debt could rise from 77 percent of GDP in 2016 to 96 percent by 2027, or perhaps more if the higher debt resulted in slower economic growth.
Changes in the Budget Projections
CBO’s latest budget projections are largely similar to prior estimates. Deficits are still projected to total $8.6 trillion over the 2017-2026 period, only $6 billion higher than in CBO’s August report. This $6 billion is the net of $315 billion less in projected revenue and $310 billion in lower projected spending.
Legislation passed since August has increased CBO’s deficit projections modestly as a result of increased spending in the uncapped war-spending Overseas Contingency Operations (OCO) fund and other uncapped spending categories. Though this budget authority increase only applied to FY 2017 and added only $15 billion to the debt directly, CBO’s baseline conventions assume that new discretionary spending continues. Thus, the increase added another $95 billion of spending over the decade. CBO projects this $110 billion of additional spending will lead to an additional $16 billion in debt service.
Changes in economic projections have had very little effect on CBO’s budget projections. Slight reductions in growth estimates are projected to reduce tax revenue and indirectly increase Medicare spending. On the other hand, slight reductions in projected inflation and interest rates reduce spending on Social Security and other inflation-indexed programs while also reducing interest payments on the debt.
Finally, technical changes in estimating methodology will lower ten-year deficits by about $133 billion, with almost one-third coming in 2017. Newer data on tax collections and the corresponding drop in projected revenue is more than offset by various technical corrections such as lower Social Security enrollment, lower Medicare spending last year, and lower enrollment in Medicaid. These technical changes also include changes to other mandatory spending, offsetting receipts, and small changes to the projection of outlays related to the health insurance marketplace.
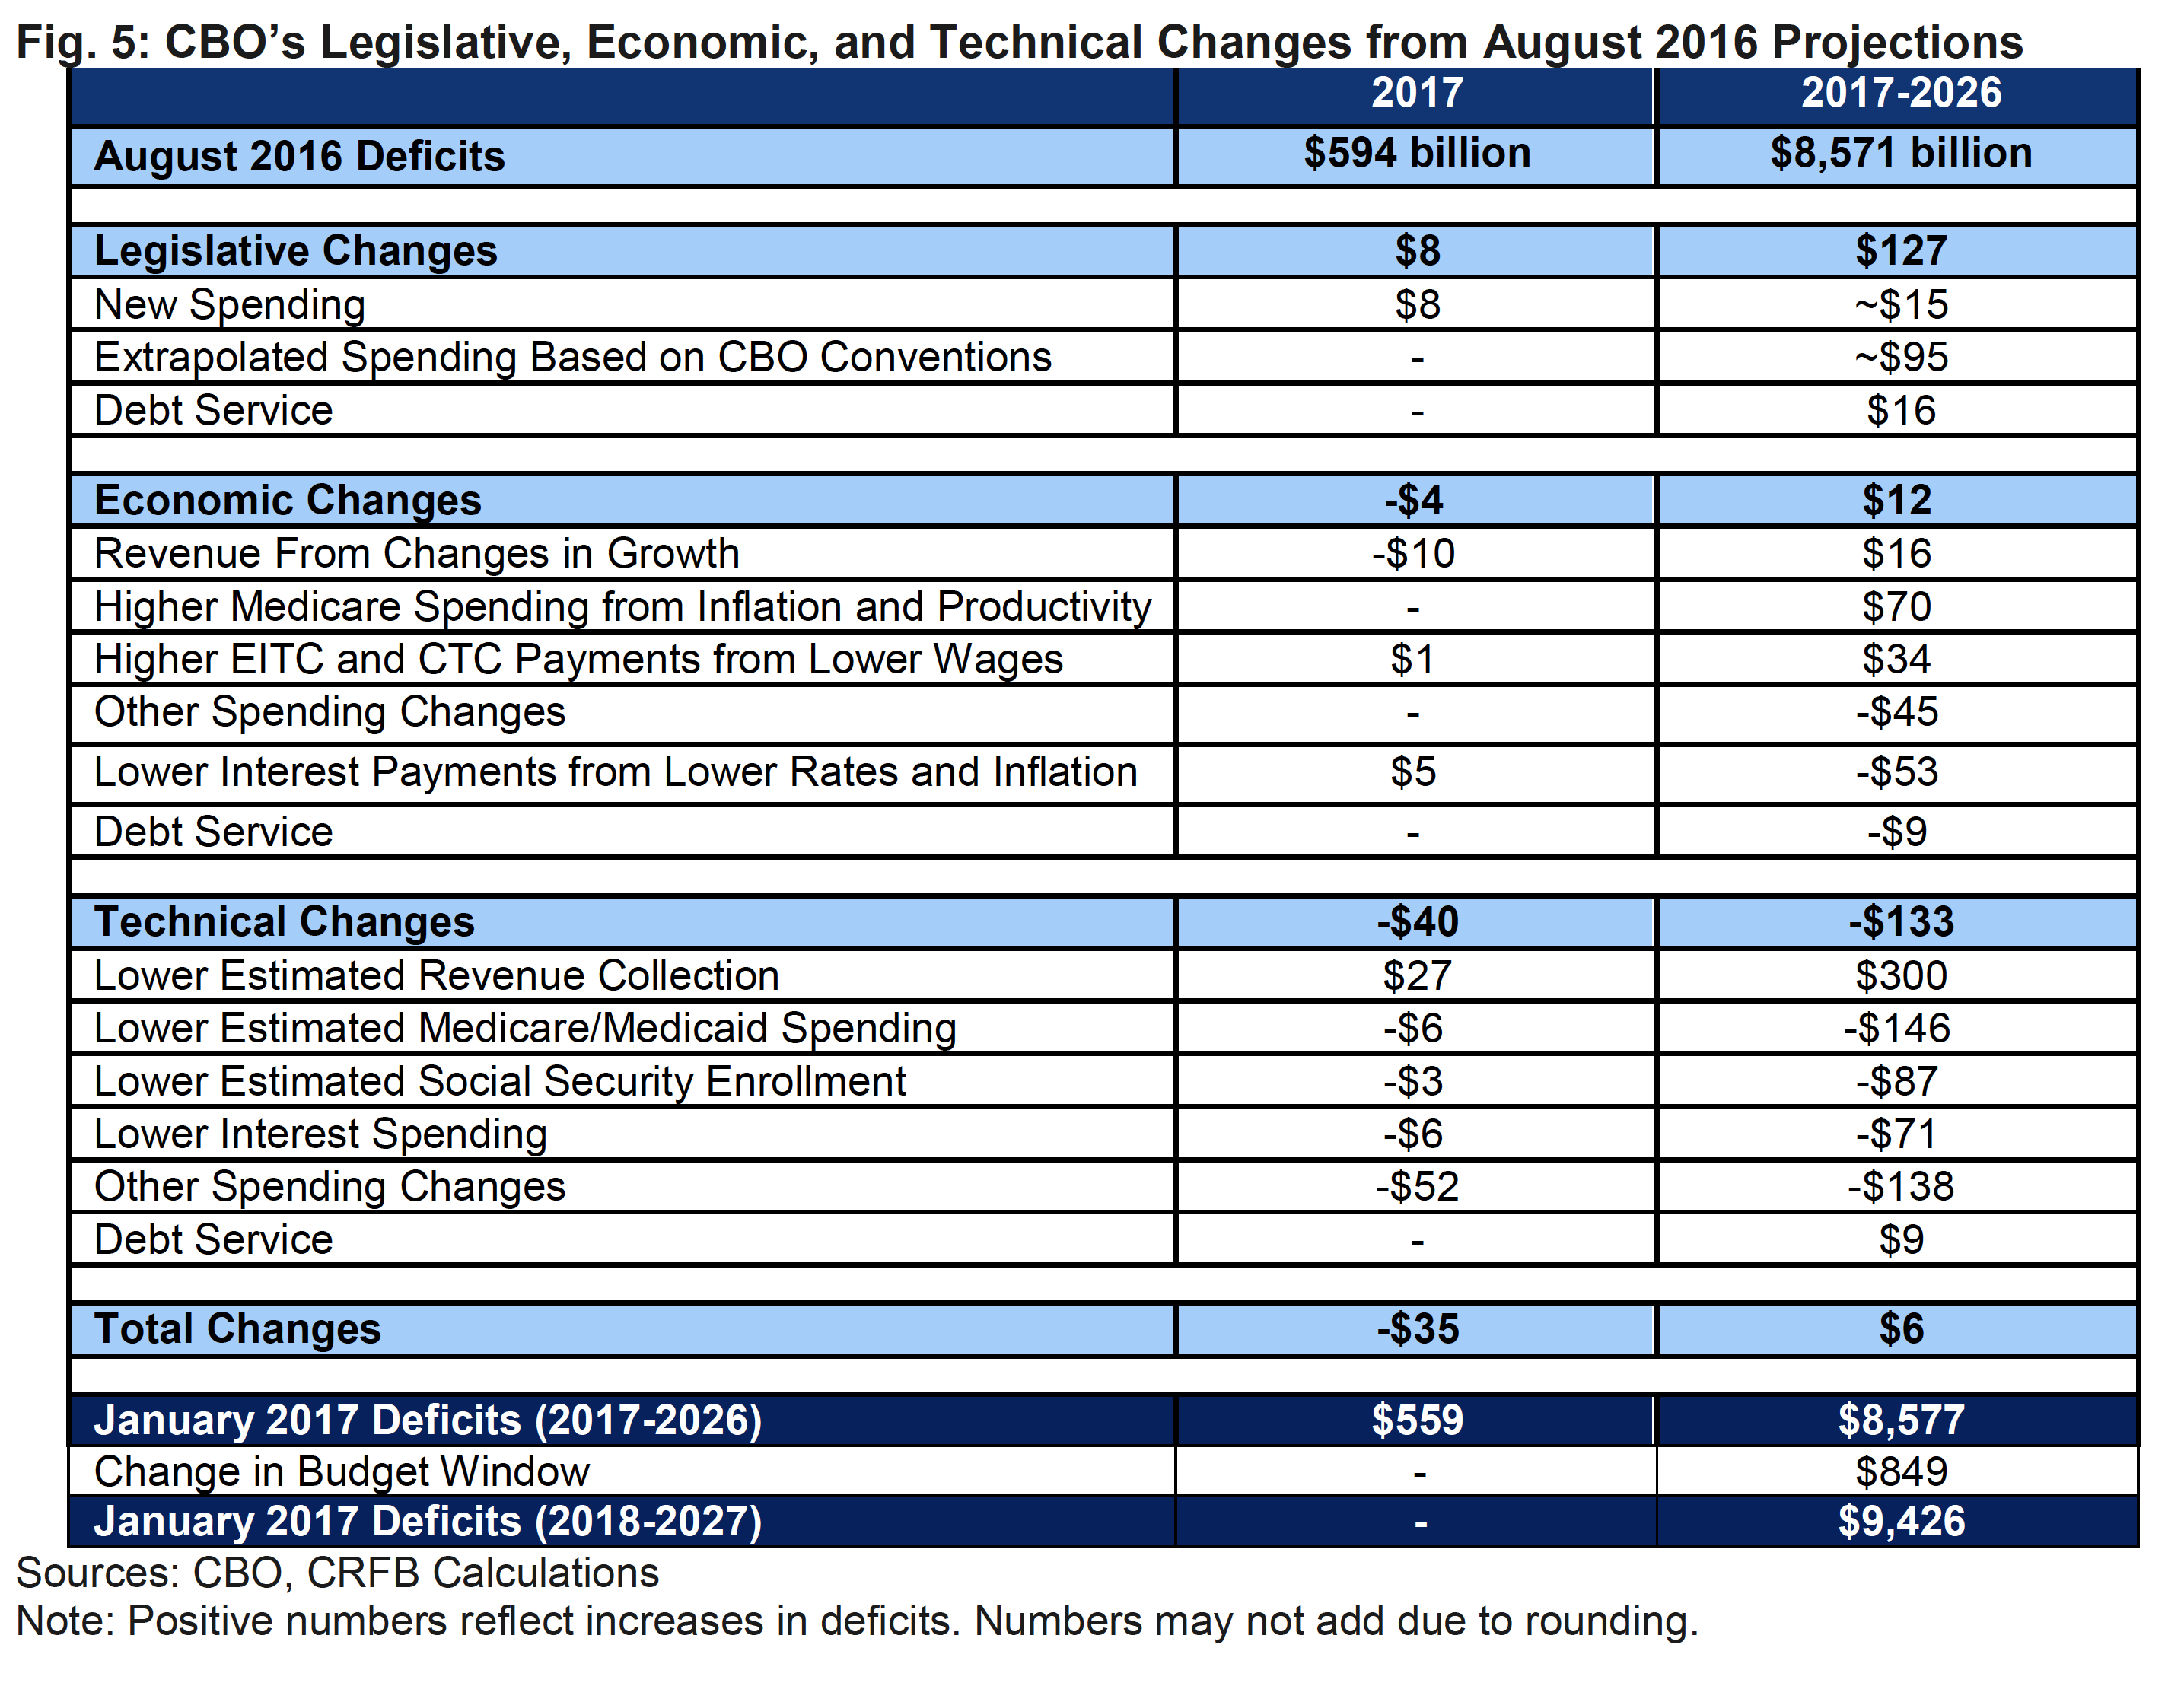
While deficit projections remain largely unchanged in dollar terms through 2026, the projected debt-to-GDP ratio is roughly 1.5 percent of GDP higher than in August (87.0 as opposed to 85.5 percent). The increase is largely driven by so called “other means of financing” that add to the debt but are not counted as adding to the deficit – including debt attributed to federal credit programs such as student loans (which only add to the deficit to the extent that they are projected to lose money over the long run) and the government’s investments in the G fund of the federal retirement Thrift Savings Plan. The debt-impact of these programs is projected to be about $210 billion larger from 2017-2026 than previously estimated.
At the same time, nominal GDP itself is projected to be about 0.4 percent lower in 2026 than was projected in August, resulting in a further drop in the debt-to-GDP ratio.
Economic Projections
In addition to updated budget projections, today’s report also includes CBO’s latest economic projections, though they are similar to CBO’s August projections.
CBO projects relatively stable growth, with slightly larger increases in GDP in the early years.
According to CBO, real economic growth will be 2.2 percent in 2017, 2.1 percent in 2018, and by 2022, CBO projects a steady growth rate of 1.9 percent. CBO also projects average annual growth over the next decade to total 1.9 percent. Previously, CBO projected average and steady growth at about 2.0 percent. As a result of the slight reduction in projected growth rates – along with new inflation estimates – CBO now projects nominal GDP to be about $88 billion, or 0.4 percent, smaller in 2026 than projected in August.
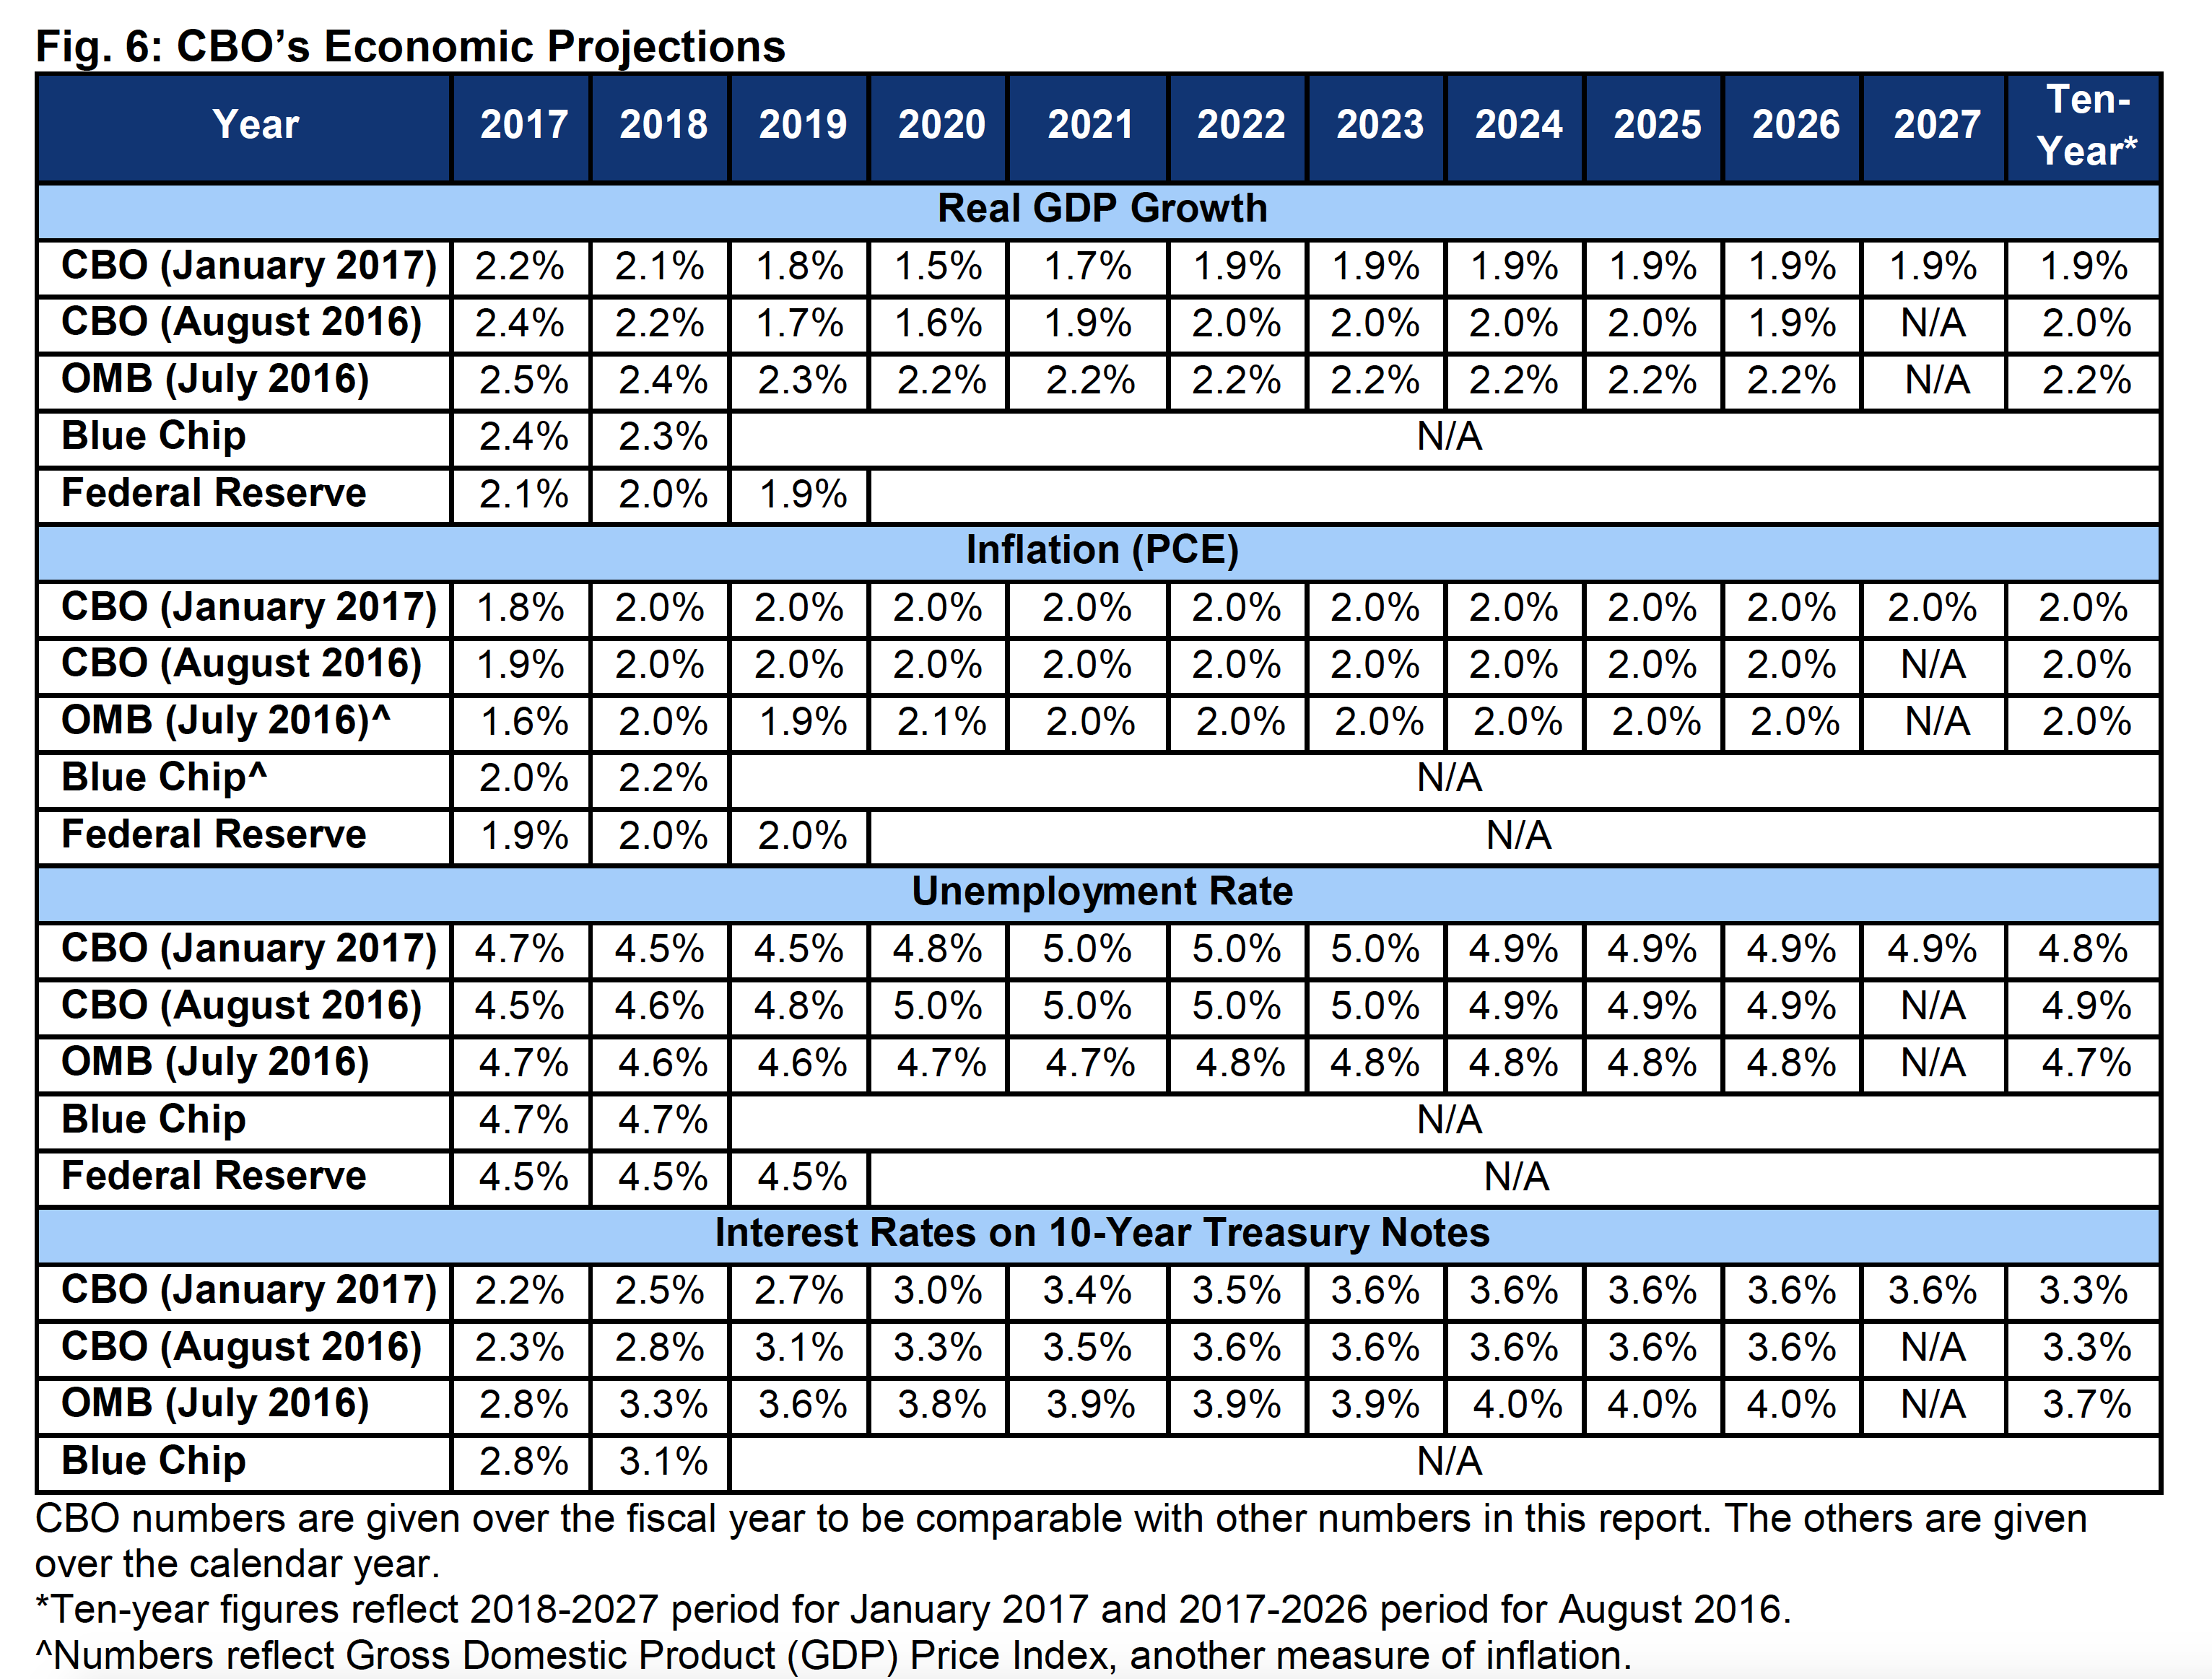
Meanwhile, CBO projects the unemployment rate to dip from its current level of 4.7 percent to a low of 4.5 percent in 2018 before rising back to 4.9 percent by 2024 and remaining there through the rest of the decade.
In terms of inflation, CBO estimates the price index for personal consumption expenditures to grow by 1.8 percent in 2017 and by 2 percent per year from 2018 onward.
Finally, interest rates will begin to rise as they have already done since November and were projected to do so in August. CBO projects rates on three-month and ten-year Treasury bonds to rise from 0.2 and 1.9 percent, respectively, in 2016 to 2.8 and 3.6 percent in 2023 and stay at that level for the rest of the ten-year window.
All three of these metrics are very close to what CBO projected in August.
CBO’s current economic projections are generally very similar to the Blue Chip projections made by private forecasters, though CBO expects slightly lower interest rates and real GDP growth than the Blue Chip average estimate. Meanwhile, CBO’s real growth projections are slightly higher than those of Federal Reserve officials. The report notes that part of the difference in forecasts may be attributable to the fact that CBO’s projections are based on current law whereas other forecasters most likely assume that policy changes will take place.
Conclusion
CBO’s latest projections continue to show an unsustainable fiscal situation, with trillion-dollar deficits returning by 2023 and the nation’s post-WWII era record-high debt rising nearly continuously over the next decade and beyond.
These numbers don’t take into account any legislative action that could alter the debt trajectory, including actions lawmakers have taken in the past (e.g. sequester relief and extensions of temporary tax breaks) or are focused on accomplishing in the coming months and years (e.g. tax reform, infrastructure spending, and/or spending cuts). If future policies increase spending or reduce revenue and are not paid for, the nation’s overall fiscal health could be significantly worse than CBO projects.
Yet even paying for all new initiatives would be insufficient to put the debt on a sustainable path. CBO finds that simply allowing debt to grow at the pace under current law would slow productivity and wage growth, increase interest rates as well as federal interest payments, reduce the government’s fiscal flexibility to deal with new challenges, and increase the likelihood of an eventual fiscal crisis.
To prevent these very dangerous consequences, policymakers must pursue a combination of tax and spending changes sufficient to slow and reverse our growing debt, ideally bringing it back toward historic levels over the longer run. Almost any plan to do so will require addressing the rapid growth of Social Security and health care spending, reforming the nation’s tax code so it raises sufficient revenue, and pursuing policy changes that promote faster economic growth.
As President Trump and the new Congress form their agendas, we hope that they will put deficit reduction on the list as a top priority.