CBO’s 2017 Long-Term Budget Outlook
The United States is on an unsustainable fiscal path, according to the Long-Term Budget Outlook released by the Congressional Budget Office (CBO) today. According to CBO, today’s post-war record-high debt will rise indefinitely as a share of the economy, which will lead to serious negative consequences.
CBO‘s latest projections show:
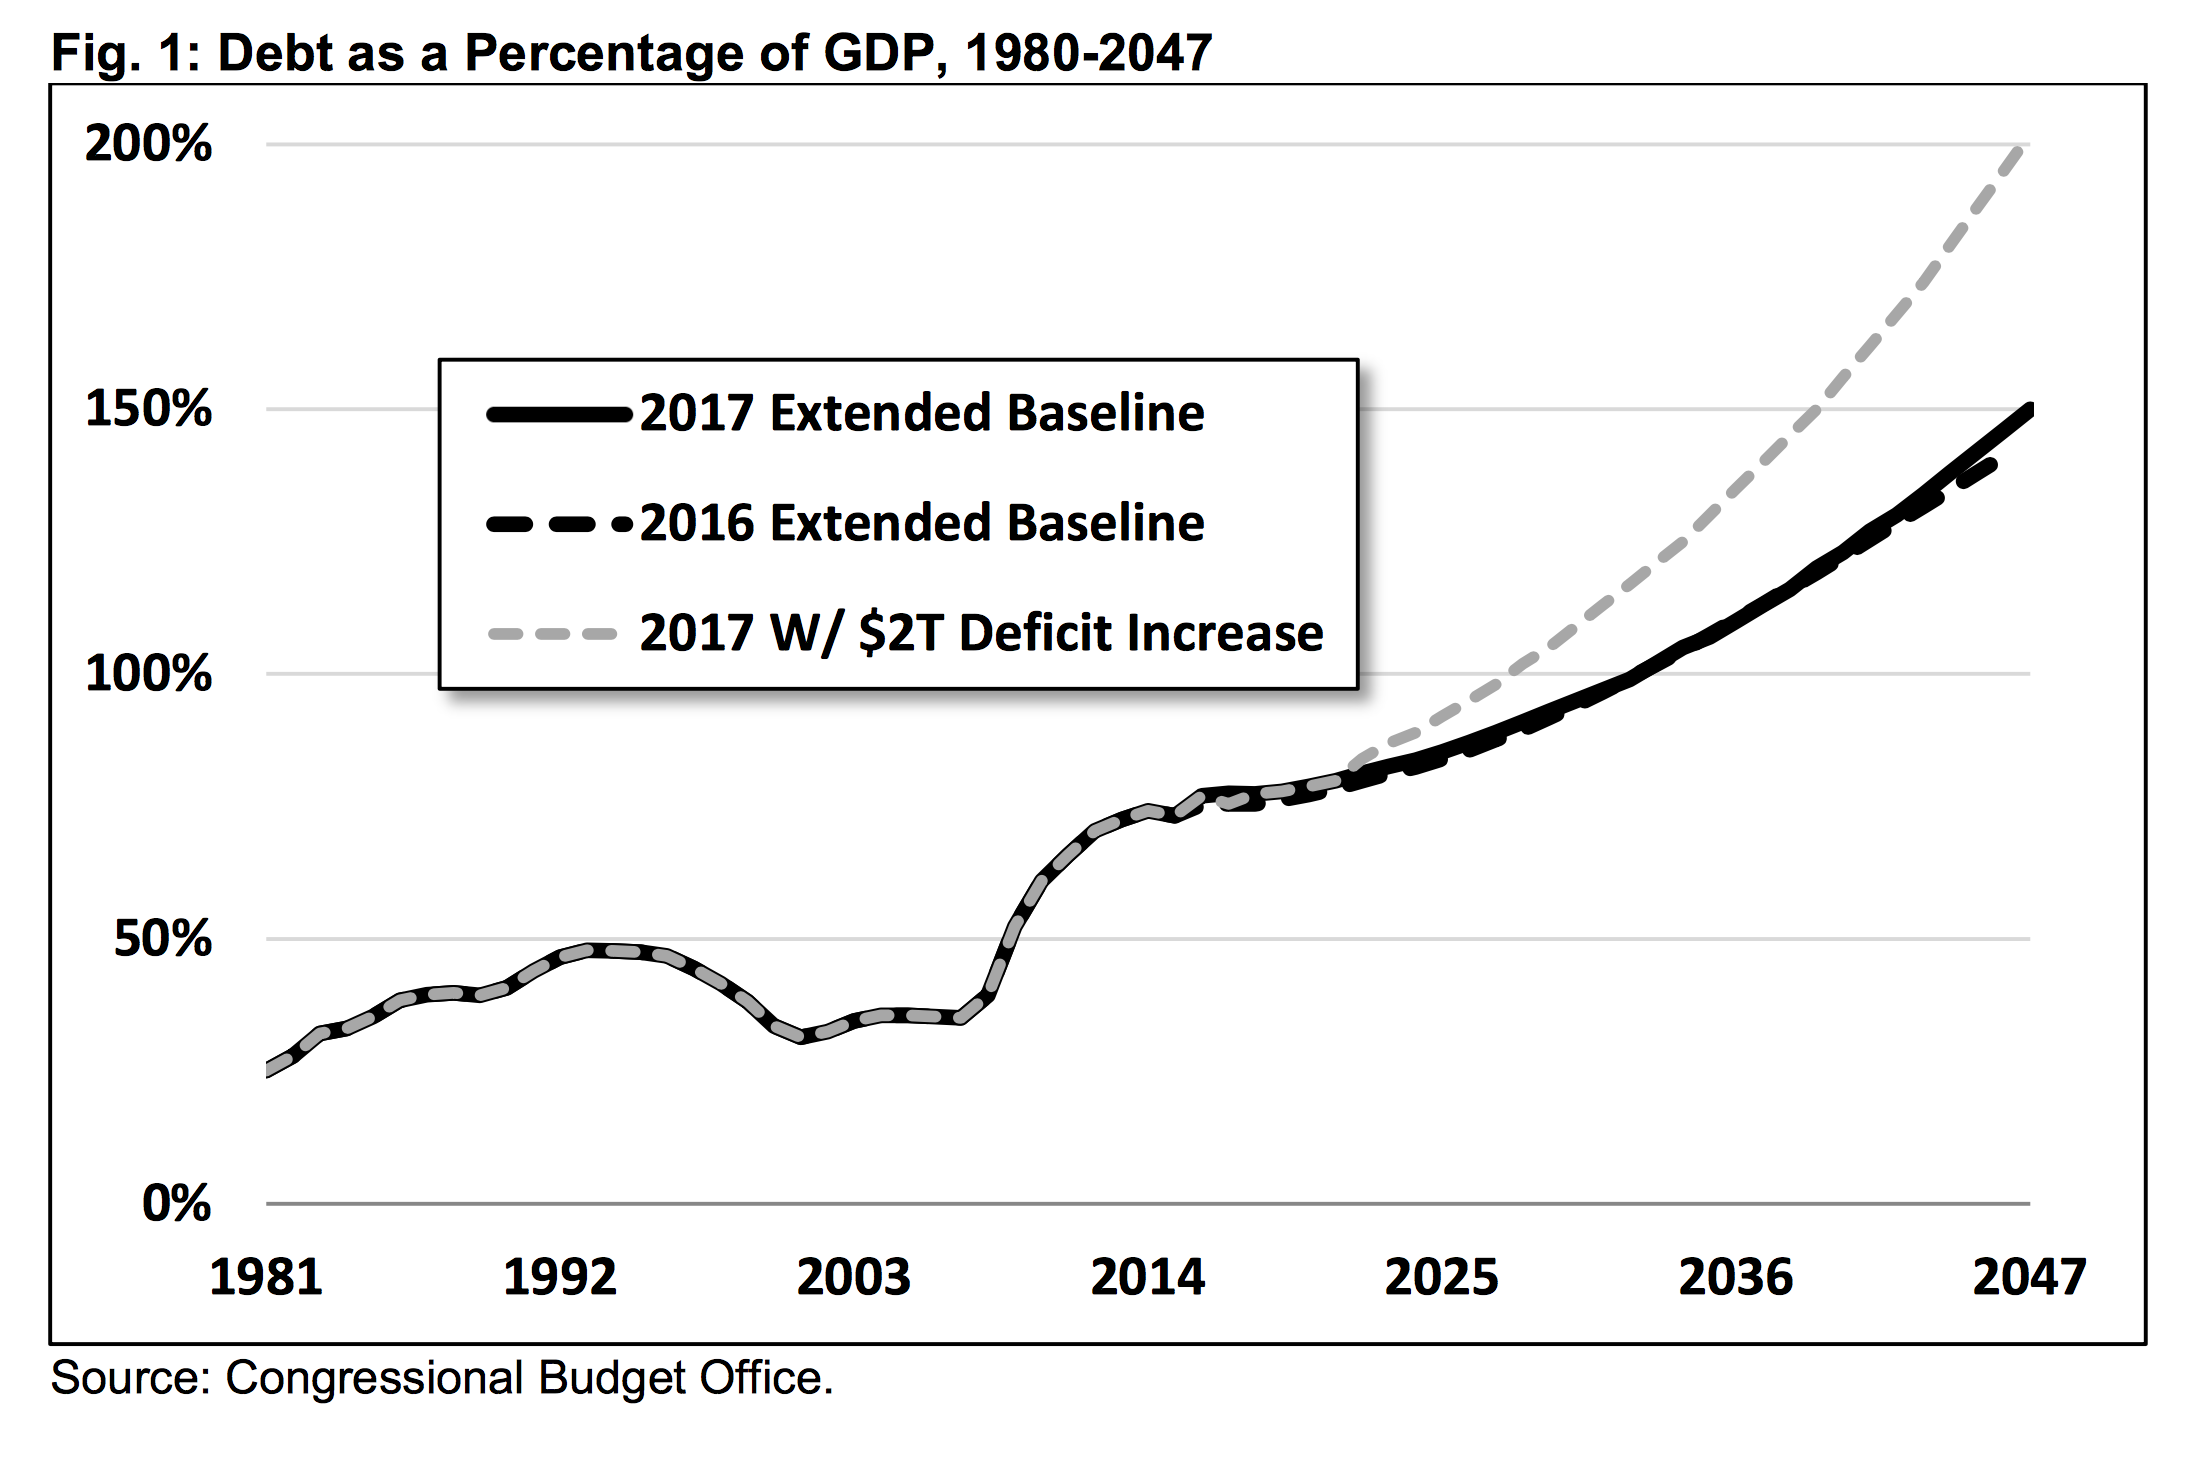
- Debt Will Grow Unsustainably. CBO finds debt held by the public will roughly double as a share of the economy over the next three decades, rising from 77 percent in 2017 to 150 percent by 2047.
- Rapid Spending Growth will Outpace Revenue. Both revenue and spending will continue to grow, but the pace of spending growth will be much faster than revenue. Revenue will grow from 17.8 percent of Gross Domestic Product (GDP) in 2017 to 19.6 percent in 2047, while spending will grow from 20.7 percent of GDP in 2017 to 29.4 percent in 2047.
- Rising Debt Will Slow Economic Growth. CBO estimates rising debt levels will shrink the economy by 3 percent relative to a base case where debt does not rise. As a result, average income will be $4,000 lower in 2047 due to rising debt levels.
- Rising Debt Has Other Important Costs. In addition to slowing economic growth, CBO warns that the growing national debt may squeeze out other important priorities, making it more difficult to respond to emergencies, and eventually increasing the risk of a fiscal crisis.
- The Cost of Waiting to Fix the Debt is High. Delaying the start of deficit reduction makes the needed adjustments larger. Spending cuts or tax increases enacted ten years in the future would need to be about 50 percent larger than changes enacted today to achieve a given fiscal target.
- Major Trust Funds are Heading Toward Insolvency. A number of major federal trust funds face exhaustion in the coming years, including the Highway Trust Fund in 2021, the Social Security Disability Insurance Trust Fund in 2023, the Medicare Part A (Hospital Insurance) Trust Fund in 2025, and the Social Security Old-Age and Survivors Insurance Trust Fund in 2031. Exhaustion of these trust funds would spell deep across-the-board cuts for their beneficiaries.
Debt Will Grow Unsustainably
At 77 percent of GDP, debt held by the public is currently at its largest share of the economy than any time since the aftermath of World War II. This record-high debt will nearly double over the next three decades as the population ages, interest costs rise, and health spending continues to grow.
CBO projects debt to exceed the size of the economy by 2033, eclipse its historic high of 106 percent of GDP by 2035, and reach 150 percent of GDP by 2047.
Rising debt levels are the result of continued deficits. CBO projects deficits to double from 2.9 percent of GDP in 2017 to 5.8 percent by 2031 and triple to 8.7 percent by 2042. By 2047, deficits will be 9.8 percent of GDP – the same record-high levels reached during the Great Recession.
CBO’s projections are generally based on the continuation of current law and thus may be more optimistic than reality. CBO assumes the sequester on defense and domestic discretionary spending will be maintained, several expiring tax breaks and delays will expire, policymakers will continue to let discretionary spending shrink as a share of the budget while revenue rises, and no new debt-financed legislation will be enacted.
If policymakers passed just $2 trillion of unpaid for tax cuts and/or spending increases over the next decade, CBO projects debt would exceed the size of the economy by 2028 and be twice as large as the economy by 2047.
Such high and rising debt levels would ultimately be unsustainable.
Rapid Spending Growth Will Outpace Revenue
Rising deficits in CBO’s projections are the result of rapid growth of spending outpacing more modest growth of revenue. According to CBO, revenue will rise from 17.8 percent of GDP in 2017 to 18.4 percent by 2027, 19.0 percent by 2037 and 19.6 percent in 2047. This is significantly higher than the 50-year historical average of 17.4 percent of GDP.
Spending will grow far more quickly, however, rising from 20.7 percent of GDP in 2017 to 23.4 percent in 2027, 26.3 percent in 2037, and 29.4 percent in 2047. For reference, spending has averaged around 20.3 percent of GDP over the last 50 years.
Fig. 2: Projections under CBO’s Extended Baseline (% of GDP)
| 2000 | 2017 | 2027 | 2037 | 2047 | |
|---|---|---|---|---|---|
| Spending | 17.6% | 20.7% | 23.4% | 26.3% | 29.4% |
| Revenue | 20.0% | 17.8% | 18.4% | 19.0% | 19.6% |
| Deficit | -2.3% | 2.9% | 5.0% | 7.3% | 9.8% |
| Debt | 34% | 77% | 89% | 113% | 150% |
Source: Congressional Budget Office
Spending growth is driven entirely by the rising costs of Social Security, health care, and interest on the debt; other areas of the budget will shrink as a share of GDP.
These three categories will nearly double in cost from 11.8 percent of GDP in 2017 to 21.8 percent by 2047. Social Security spending, driven by the aging of the population, will rise by 1.4 percent of GDP over that period. Health spending, driven by an aging population and rising per-person health costs, will rise by 3.8 percent of GDP. Interest payments on the debt, driven by normalizing interest rates and growing debt levels, will rise by 4.8 percent of GDP.

Rising Debt Will Slow Economic Growth
CBO projects that debt will slow economic growth over the next 30 years. Higher debt will crowd out private investment in favor of Treasury bonds; that crowding out will slow productivity and wage growth, diminishing economic potential.
Relative to CBO’s base case, they estimate projected increases in debt levels will slow economic growth so that the economy in 2047 would be 3 percent smaller. Relative to debt on a downward path, the reduction in economic growth is even greater.
Slower economic growth translates to lower income. The rising debt projected in the baseline will reduce average income (measured by per-capita Gross National Product) in 2047 by $4,000 from a projected $90,000 to $86,000. Compared to a scenario where debt is on a downward path relative to the economy ($4 trillion of deficit reduction over 10 years) – income is projected to be $5,000 lower.
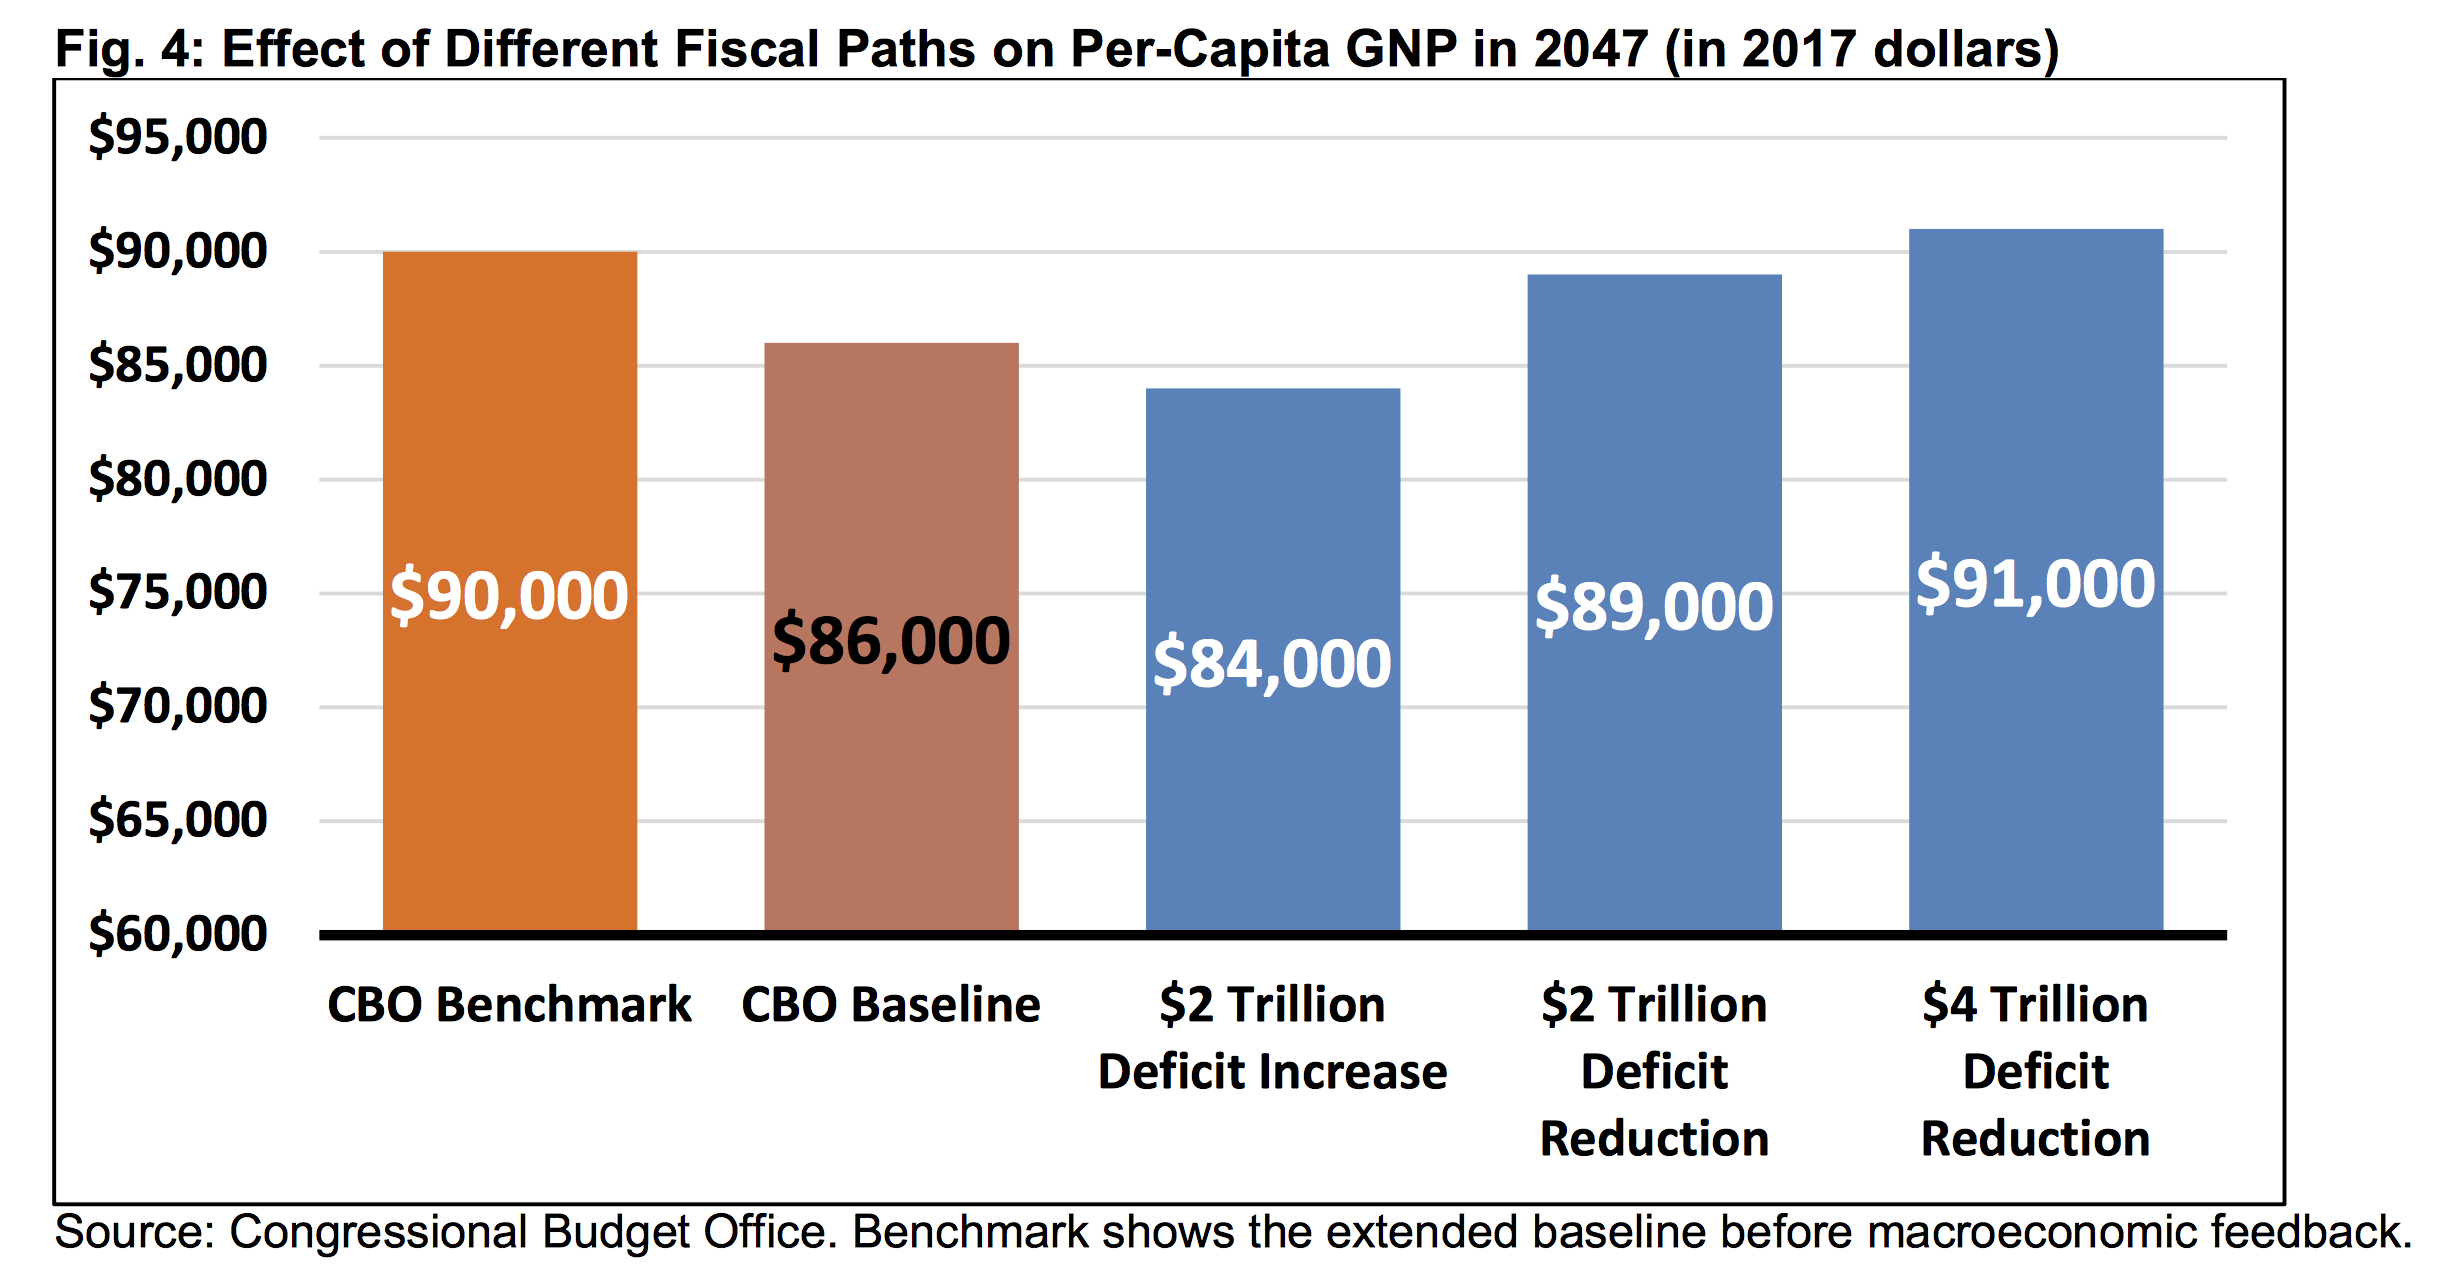
If policymakers add to the debt, income growth will slow further. For example, if they were to pass $2 trillion of tax cuts and spending increases over the next decade, average income will fall by an additional $2,000 per person by 2047.
CBO also estimates that rising debt will increase projected interest rates. CBO projects total interest rates paid by the federal government will be 0.5 points (13 percent) higher than they otherwise would be by 2047, while 10-year Treasury notes will be 0.9 points (23 percent) higher.
These rising interest rates not only increase interest costs for the government but would likely flow through to higher interest rates on mortgages, credit cards, car loans, and business loans.
Rising Debt Has Other Important Costs
High and rising debt will slow long-term economic growth and carries with it other economic and policy consequences.
First, rising debt could crowd out other important budget priorities. Growing debt will tend to lead to higher federal interest costs, both because interest is paid on an increasing amount of debt and because the accumulation of debt itself can increase interest rates. At any given fiscal target, higher spending on interest will necessarily mean a reduction in other government spending, higher taxes, or some combination.
Second, higher debt will reduce the government’s flexibility to respond to emergencies or changing priorities. For example, policymakers allowed debt as a share of GDP to nearly double during the Great Recession to accommodate automatic stabilizers, fiscal stimulus, and financial stabilization measures. With today’s relatively high debt levels, it would be more difficult either economically or politically to do the same thing in response to another severe recession or other emergency. In addition, high debt may make policymakers more unwilling to undertake new spending or tax policies that have a significant fiscal impact.
Finally, growing levels of debt increase the risk of fiscal crisis. In such a crisis, CBO explains:
[…I]nvestors might become less willing to finance federal borrowing unless they were compensated with high returns. If so, interest rates on federal debt would rise abruptly, dramatically increasing the cost of government borrowing. That increase would reduce the market value of outstanding government securities, and investors could lose money. The resulting losses for mutual funds, pension funds, insurance companies, banks, and other holders of government debt might be large enough to cause some financial institutions to fail, creating a fiscal crisis.”
It is very difficult to predict when such a crisis would occur, but higher levels of debt make the odds of a crisis more likely and increase the difficulty of quickly reducing debt levels.
Higher debt increases the share of the budget going towards interest spending, decreases the nation’s ability to respond to emergencies or changing priorities, and increases risk of a fiscal crisis. As we show in the next section, addressing high debt will only become more difficult the longer policymakers put it off.
The Cost of Waiting to Fix the Debt is High
Putting debt on a sustainable path will require significant spending cuts, revenue increases, or more likely both. However, delaying action will increase the size of the needed adjustment for a given fiscal target. Waiting ten years will increase the needed adjustment by about 50 percent.
According to CBO, holding the debt-to-GDP ratio to its current high levels for the next three decades will require annual tax or spending adjustments (excluding interest) of 1.9 percent of GDP if they start in 2018 – the equivalent of $4.5 trillion. On the other hand, waiting a decade to act would require adjustments of 2.9 percent of GDP, the equivalent of $6.9 trillion.
Similarly, reducing the debt to its 50-year historical average of about 40 percent of GDP would require adjustments of 3.1 percent of GDP, the equivalent of $7.3 trillion of ten-year non-interest savings. Waiting ten years will increase the size of the adjustment needed to 4.6 percent of GDP, the equivalent of $10.9 trillion over a decade.
Thought of another way, waiting ten years would increase would increase the necessary spending cuts to stabilize the debt from 9 percent to 15 percent, and to reduce debt to historic levels from 15 to 23 percent. The size of the necessary tax increase would similarly rise.

In addition to increasing the size of changes, delaying action on the debt will also leave policymakers less time to phase in policies, less ability to exempt current beneficiaries from changes, and less warning for households and businesses to prepare and adjust.
Major Trust Funds Are Heading Toward Insolvency
According to CBO, a number of major federal trust funds face exhaustion in the coming years. The Highway Trust Fund is estimated to be depleted by 2021, and the Social Security Disability Insurance Trust Fund is projected to be exhausted by 2023. The Medicare Hospital Insurance (HI) Trust Fund is projected to run out by 2025. In 2031, the Social Security Old-Age and Survivors Insurance Trust Fund will become insolvent.
Assuming continued reallocation between the two Social Security trust funds, CBO expects that on a combined basis they will be depleted in 2030, at which point benefits would have to be cut by about 27 percent to bring the programs costs in line with dedicated revenues.
Avoiding insolvency for Social Security over the next 75 years will require immediate adjustments equal to 1.5 percent of GDP, which is the equivalent of a roughly 36 percent (4.4 percentage point) increase in the payroll tax rate or a 24 percent cut in benefits.
Medicare’s HI Trust Fund faces insolvency due to increasing health care costs and the same demographic pressures facing Social Security. The HI Trust Fund is expected to run out in 2025, when it would face a $63 billion deficit requiring a 13 percent across-the-board cut in payments.
These automatic reductions do not factor into CBO’s overall budget numbers since CBO assumes that policymakers will transfer money to each trust fund as necessary to prevent benefit cuts. CBO estimates that achieving Social Security solvency alone would reduce projected debt in 2047 from 150 percent of GDP to 111 percent. We estimated previously that making all trust funds solvent through spending or revenue changes could roughly stabilize debt at its current record-high levels over the long term.
Fig. 6: What Will Happen to the Major Trust Funds
| Exhaustion Date | Annual Deficit In Exhaustion Year | Percent Cut At Insolvency | |
|---|---|---|---|
| Highway Trust Fund (combined) | 2021 | $18 billion (0.1% of GDP) | 32% |
| Medicare Hospital Insurance Trust Fund | 2025 | $63 billion (0.2% of GDP) | 13% |
| Social Security Disability Insurance Trust Fund | 2023 | $31 billion (0.1% of GDP) | 17% |
| Social Security Old-Age & Survivors Insurance Trust Fund | 2031 | $530 billion (1.6% of GDP) | 29% |
| Addendum: Theoretical Combined Social Security Trust Funds | 2030 | $540 billion (1.7% of GDP) | 27% |
Significant adjustments are needed to ensure benefits can be paid for current and future generations. There adjustments would also significantly improve CBO’s long-term outlook. As with fixes to the overall debt, the sooner those adjustments are made, the smaller and easier they will be.
Conclusion
CBO’s long-term outlook shows that the federal government faces a clearly unsustainable long-term fiscal picture. Under its Extended Baseline, CBO projects debt will rise nearly continuously from its current post-war record high level of 77 percent of GDP, surpass its all-time record within 20 years, and reach 150 percent of GDP in 30 years. Simply put, debt is projected to double over the next 30 years, and deficits will more than triple.
Policymakers could also make this situation worse. Unpaid-for tax reform, infrastructure spending, or defense hikes could significantly worsen the nation’s fiscal picture. If the combined cost of unpaid-for initiatives totals just $2 trillion over the next decade, debt will exceed the size of the economy by 2028 and exceed 200 percent of GDP by 2047.
To avoid worsening an already unsustainable fiscal situation, policymakers should ensure new policies are fully paid for with offsetting revenue or spending reductions. To the extent any policy initiatives promote economic growth, the gains from that growth should be used as a down payment to bring our long-term debt under control.
Policymakers must go far beyond paying for new initiatives in order to reverse an extremely bleak fiscal situation. Specifically, they must substantially slow the growth of Social Security and health care spending – the true drivers of rising debt – and must finance any remaining growth with revenue increases, spending cuts, or some combination.
Deficit reduction, combined with thoughtful and responsible tax and spending reforms, can help encourage economic growth and boost incomes over the long run. Failure to act, however, will slow economic growth, reduce projected incomes, increase the cost of living, and leave the government less equipped to deal with future needs and priorities.
These numbers are calculated based on the 2018-2027 window for a direct comparison to the data starting in 2018. Actual cuts experienced in that window with the delays would be notably less but larger over their respective first ten years of implementation.
What's Next
-
Image

-
Image

-
