Analysis of the 2018 Medicare Trustees' Report
The Medicare Trustees have released their 2018 report on the financial status of Medicare. The report shows that Medicare spending will increase significantly over the next few decades, and the Part A Hospital Insurance (HI) trust fund will be insolvent in just eight years.
Highlights of the report include:
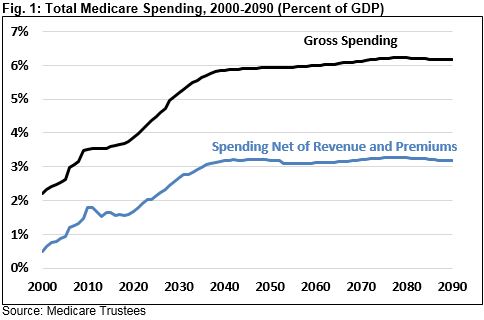
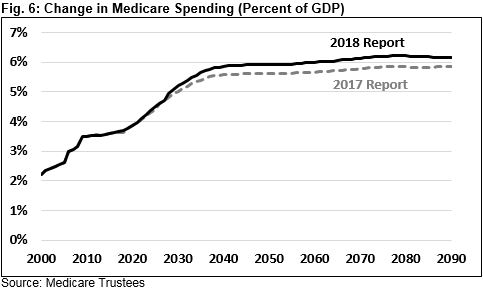
- Gross Medicare spending is projected to grow sharply from 3.7 percent of GDP in 2017 to 4.7 percent in 2027 and 5.9 percent by 2040. After that, it will grow more gradually to 6.2 percent by 2090. Spending growth is largely due to growth in the number of beneficiaries and per-capita health care costs.
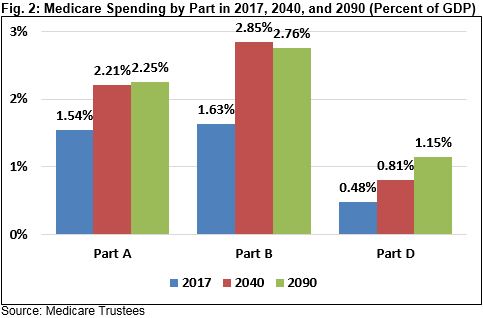
- This spending growth is spread relatively evenly across Parts A, B, and D, though Part D is the fastest-growing part of Medicare. As a share of GDP, Part D will grow by 140 percent between 2017 and 2090, Part B will grow by 69 percent, and Part A will grow by 46 percent.
- The Trustees’ projections assume current law, but Medicare’s Chief Actuary notes that several payment policies that would hold down costs may prove to be financially unsustainable and threaten access. If those policies were scaled back, Medicare spending would increase much more rapidly to 8.8 percent of GDP by 2090.
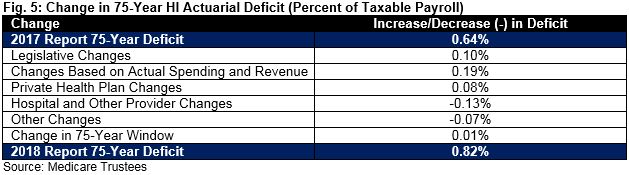
- The HI trust fund is expected to be insolvent by 2026. The trust fund’s 75-year actuarial shortfall is 0.82 percent of taxable payroll, meaning that it would take about that much of a payroll tax increase or an equivalent amount of spending cuts to maintain solvency over 75 years.
- This year’s report is somewhat worse than last year’s report. Medicare spending is projected to reach 6.2 percent of GDP in 2090, compared to 5.9 percent in last year’s report. The HI trust fund will go insolvent in 2026 and face a 0.82 percent of payroll shortfall compared to a 2029 insolvency date and a 0.64 percent of payroll shortfall in last year’s report.
The Trustees show that Medicare spending is projected to increase significantly as a share of GDP over the next few decades, with each part of Medicare contributing to that cost growth. In addition, lawmakers face a near-term financial challenge as the HI trust fund will be exhausted by 2026. Lawmakers need to undertake changes to Medicare benefits and payment policies to contain its growth.
Medicare Spending Is Growing Rapidly
As a share of GDP, gross Medicare spending is expected to grow significantly over the long term and especially over the next few decades.
The Trustees project that gross Medicare spending will increase from 3.7 percent of GDP in 2017 to 4.7 percent in 2027 and 5.9 percent by 2040. Growth will then slow significantly as demographics stabilize, with costs reaching 6.2 percent of GDP by 2090.
Importantly, Medicare Part A is largely financed by a payroll tax, and other parts of Medicare are partially financed through beneficiary premiums. Net of these and other funding sources, spending is lower but growing somewhat more rapidly. The Trustees project unfinanced spending on Medicare will double from 1.6 percent of GDP in 2017 to 3.2 percent by 2040 and remain at about that level after that.
The aging of the population is the primary driver of Medicare cost growth. The number of Medicare beneficiaries has already grown from 40 million in 2000 to 58 million last year, and is projected to grow 87 million by 2040 and 116 million by 2090.
Per-capita increases in health care spending also play a role in Medicare spending increases, as. nominal per-person Medicare spending is expected to triple from about $13,200 in 2017 to about $38,800 by 2040. By comparison, prices and GDP per capita are only projected to grow by 80 percent and 130 percent, respectively. Beyond 2040, per-person Medicare spending is projected to grow at about the rate of the economy, though this slower growth is largely due to payment policies the Chief Actuary does not view as sustainable.
All Parts of Medicare Are Growing
Spending increases in Medicare are spread between Parts A, B, and D, which finance inpatient care, outpatient care, and prescription drugs, respectively. Between now and 2090, Part A will be responsible for 28 percent of Medicare spending growth as a share of the economy, Part B will be responsible for 45 percent, and Part D will be responsible for 27 percent. Nearly all the growth in Parts A and B will occur between now and 2040, while Part D will continue to grow beyond then.
Part D is the smallest part of Medicare, but it will grow the fastest: its costs as a share of GDP will grow 140 percent by 2090. Part B’s share of GDP will grow 69 percent and Part’s A share will rise 46 percent. The Trustees attribute Part D’s faster growth to higher input price growth.
Included in these overall spending numbers are data on private health plans in Medicare Advantage, which provides coverage equivalent to Parts A and B. Medicare Advantage’s role in Medicare has grown significantly since its enactment 15 years ago, with total enrollment doubling from 10 million to 20 million people between 2008 and 2017.
The Trustees expect that enrollment will continue to grow to 29 million by 2027, with the share of enrollees increasing from 34 to 39 percent of total Medicare enrollment over that time. Total payments to private plans will also increase from $209 billion in 2017 to $497 billion by 2027. Since the Trustees expect Medicare Advantage plans to be more costly on average for Medicare than traditional Medicare, the growth in the share of enrollees in private plans increases Medicare spending relatively to what it would be if that share remained stable.
Actual Spending Growth Could Be Worse
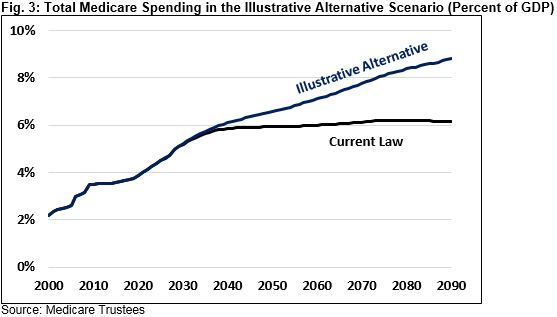
The projections discussed in the previous two sections assume current law, meaning that lawmakers make no changes in law that would affect the Medicare program. However, in a letter accompanying the Trustees report, the Office of the Actuary (OACT) of Medicare states that some payment policies embedded in current law will result in payment levels that might be inadequate, threatening access for beneficiaries. Therefore, the Trustees develop an illustrative alternative scenario to show what might be considered more realistic payment levels.
The payment policies changed in the alternative scenario are the relatively slow annual physician payment increases specified in the 2015 physician payment law, the 2025 expiration of bonuses for physicians who participate in alternate payment models, and annual payment reductions for productivity growth. These policies would result in Medicare hospital and physician payments being just 37 and 24 percent of what private insurance payments would be, respectively, down from 60 and 75 percent currently. OACT estimates that half of hospitals and most skilled nursing facilities and home health agencies would have negative profit margins by just 2040, making the prospect of maintaining these policies for 75 years unreasonable.
The alternative scenario instead assumes that productivity adjustments are reduced from an average of 1.1 percent per year to 0.4 percent between 2028 and 2042, physician payment updates would gradually increase from 0.6 percent per year to 2.2 percent between 2028 and 2042, and the bonuses would continue.
These changes would result in much higher Medicare spending. Total spending as a share of GDP would increase to 8.8 percent of GDP by 2090 rather than 6.2 percent under current law. Clearly, the alternative scenario shows a much more challenging financial situation for Medicare.
The Hospital Insurance Trust Fund Is Eight Years from Insolvency
Medicare Part A is financed mainly from payroll taxes through the Hospital Insurance (HI) trust fund. The Trustees project that as Part A spending grows, that trust fund will soon deplete its reserves.
The HI trust fund ended 2017 with a balance of roughly $200 billion, but the Trustees project spending will exceed revenue (and interest) this year and beyond. The HI trust fund is projected to become insolvent by 2026, only eight years from now when today’s 57 year-olds enter the program and today’s newest Medicare beneficiaries turn 73.
At the point of trust fund exhaustion, the law calls for payments to be cut by 9 percent to bring spending in line with revenue, with that cut rising to 22 percent by 2040. If allowed to take effect, this cut might result in restricted access to Medicare providers.
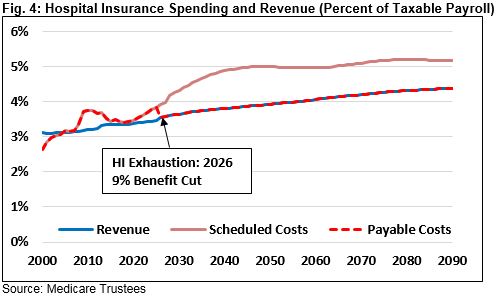
Importantly, cuts could be avoided through a plan to make Medicare Part A solvent. Such a plan would ideally close the program’s 75-year funding gap, which the Trustees estimate to be 0.82 percent of payroll, the equivalent of 21 percent of revenue or 17 percent of spending. This shortfall would grow to a high of 1.1 percent of payroll in 2045 before slowly shrinking to 0.8 percent by 2090, equal to 15 percent of revenue or 18 percent of spending.
Under the Chief Actuary’s alternative scenario, the shortfall would be larger, though the insolvency date would remain the same. HI’s 75-year deficit would double from 0.82 percent to 1.71 percent of payroll and HI spending in 2090 would increase from 2.3 percent of GDP to 3.5 percent. The 75-year shortfall would be 43 percent of revenue or 30 percent of spending, so it would take a much larger change to ensure solvency.
Medicare’s Outlook is Worse than Last Year
This year’s Trustees’ report shows a worse outlook for Medicare compared to last year’s. Medicare spending is projected to reach 5.9 percent of GDP by 2040 and 6.2 percent by 2090 compared to the 5.6 percent and 5.9 percent, respectively, projected last year. The HI trust fund’s actuarial deficit is 0.82 percent of payroll compared to 0.64 percent projected last year.
HI’s worse financial status is partly due to recent legislation. In particular, repealing the Independent Payment Advisory Board (IPAB) and the individual mandate will increase the actuarial deficit by 0.10 percent of payroll. Other changes also contribute to the increase in the HI deficit. Higher spending and lower revenue in 2017 increase the deficit by 0.19 percent, higher private health plan payments increase the deficit by 0.08 percent, and shifting the 75-year window from 2017-2091 to 2018-2092 increases the deficit by 0.01 percent. By contrast, lower utilization reduces the deficit by 0.13 percent, and several other changes reduce the deficit by 0.07 percent.
Part B also shows higher spending than in the 2017 Trustees report, while Part D shows slightly lower spending in the near term but similar spending over the long term. IPAB repeal and higher payments to Medicare Advantage plans are responsible for higher Part B spending, while broader prescription drug developments will lower Part D spending in the near term.
Conclusion
The 2018 Medicare Trustees’ report shows Medicare spending rising rapidly as a share of GDP over the next quarter century and the HI trust fund becoming insolvent by 2026. The illustrative alternative scenario that includes more realistic payment policies shows Medicare spending rising even more substantially over the long term. Either scenario shows a situation where the federal government will need to dedicate a growing share of its budget to Medicare over time.
Lawmakers need to get serious about reducing Medicare spending growth over the long term. Though some growth is likely unavoidable due to the retirement of the Baby Boomers, lawmakers should work to hold down per-person costs as much as possible and ensure that the cost constraint inherent in current law after 2040 is made sustainable. These policies will ensure a more stable and secure Medicare program and a much brighter fiscal future.
This paper is part of the American Health Care Initiative, a joint collaboration of the Committee for a Responsible Federal Budget and the Concerned Actuaries Group dedicated to informing the public, policymakers, and key stakeholders regarding the fiscal and managerial challenges confronting our health care system. As part of the initiative, the two organizations will each publish and promote a series of papers, briefings, presentations, and other materials intended to energize a much needed conversation about improving the sustainability and accessibility of our health care system and managing the rising costs that threaten our current system.
What's Next
-
Image

-
Image

-
Image