Americans Show They Can Make Tough Federal Budget Decisions and Reduce National Debt
The national debt currently is the highest it has been as a share of the economy since just after World War II, and it is rising rapidly. This high and rising debt is ultimately unsustainable, and could have severe adverse consequences, including slower income growth, a weakened ability to respond to the next recession or emergency, a larger burden on future generations, and heightened risk of a fiscal crisis.
Fixing the national debt requires getting the federal budget onto a sustainable path by increasing future revenue, reducing future spending, or some combination. To illustrate the tough budget trade-offs involved and promote an informed conversation about fiscal responsibility, the nonpartisan Committee for a Responsible Federal Budget launched an interactive tool called the Debt Fixer.
The tool has been newly updated to account for the Bipartisan Budget Act of 2019 and the latest budget baseline from the Congressional Budget Office and to reflect the current set of options under consideration by policymakers. In conjunction with the launch of the updated version of the tool, we are releasing the results from the previous version.
Background
The Debt Fixer gives users the opportunity to confront many of the same budget decisions that lawmakers face and to see how those choices affect the debt. Absent policy change, we projected debt would rise from 79 percent of GDP this year to 95 percent in a decade and 155 percent in 2050.
Users were asked to make choices on 90 different policy options with the goal of putting the debt on a downward path toward 70 percent of Gross Domestic Product (GDP) within ten years and 40 percent of GDP, about the post-war historic average, by 2050.
Options covered specific policies or sets of policies within seven categories. With each option, users were provided with a description of the policy and its short- and long-term costs or savings.
Debt Fixer Results
Since July 2018, over 180,000 users visited our Debt Fixer tool and more than 10,000 of those voluntarily submitted their choices to share publicly. The results demonstrate that there is more support for reducing the debt with new government spending and tax policies than the current hyper-partisanship and inaction in Congress indicate.
- 69 percent of users successfully reached the goal of reducing the debt to 70 percent of the economy in ten years.
- 62 percent hit the benchmark of reducing debt to 40 percent of GDP by 2050.
- The average user achieved $7.6 trillion in debt reduction over a decade. That includes 75 percent of users who attained at least $7 trillion in savings and another 11 percent who identified $5 to $7 trillion in savings – enough to stop the debt from climbing further.
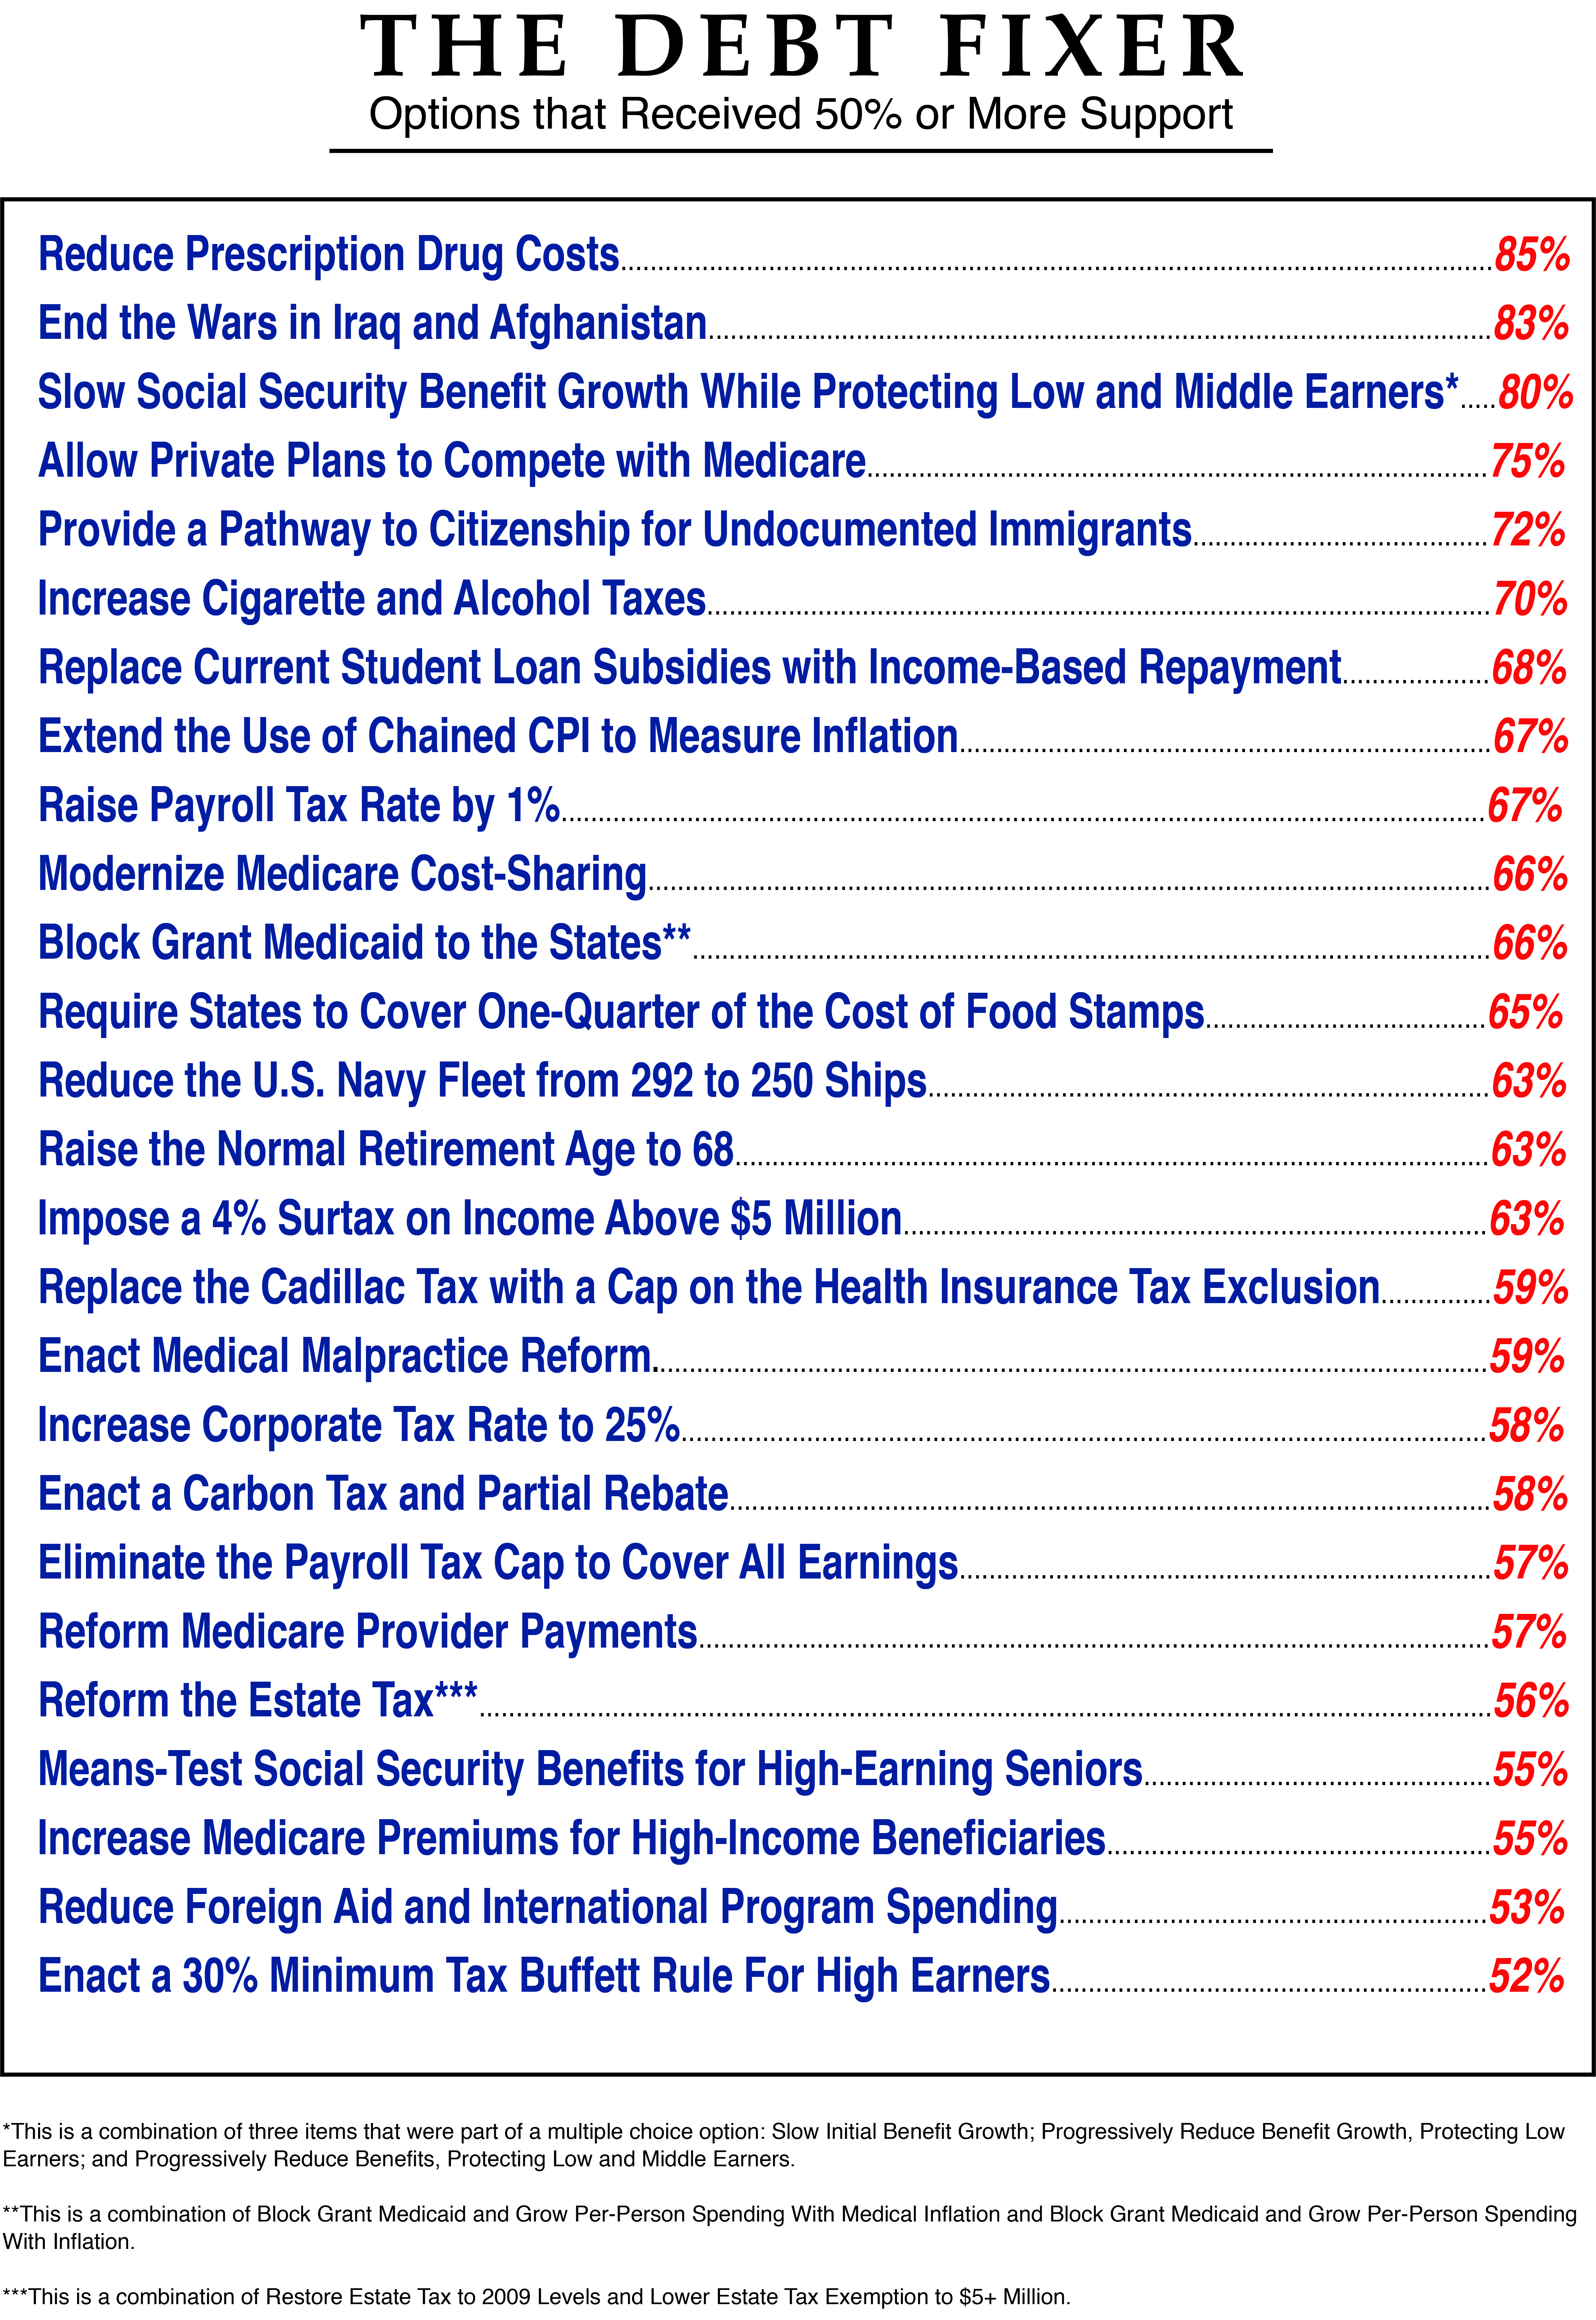
- If one only chose options with majority support, debt would remain stable at below 80 percent of the economy over the next decade and fall to nearly 40 percent in 2050. The results indicate broad support for many policies that together can reduce the debt substantially.
Notable Selections
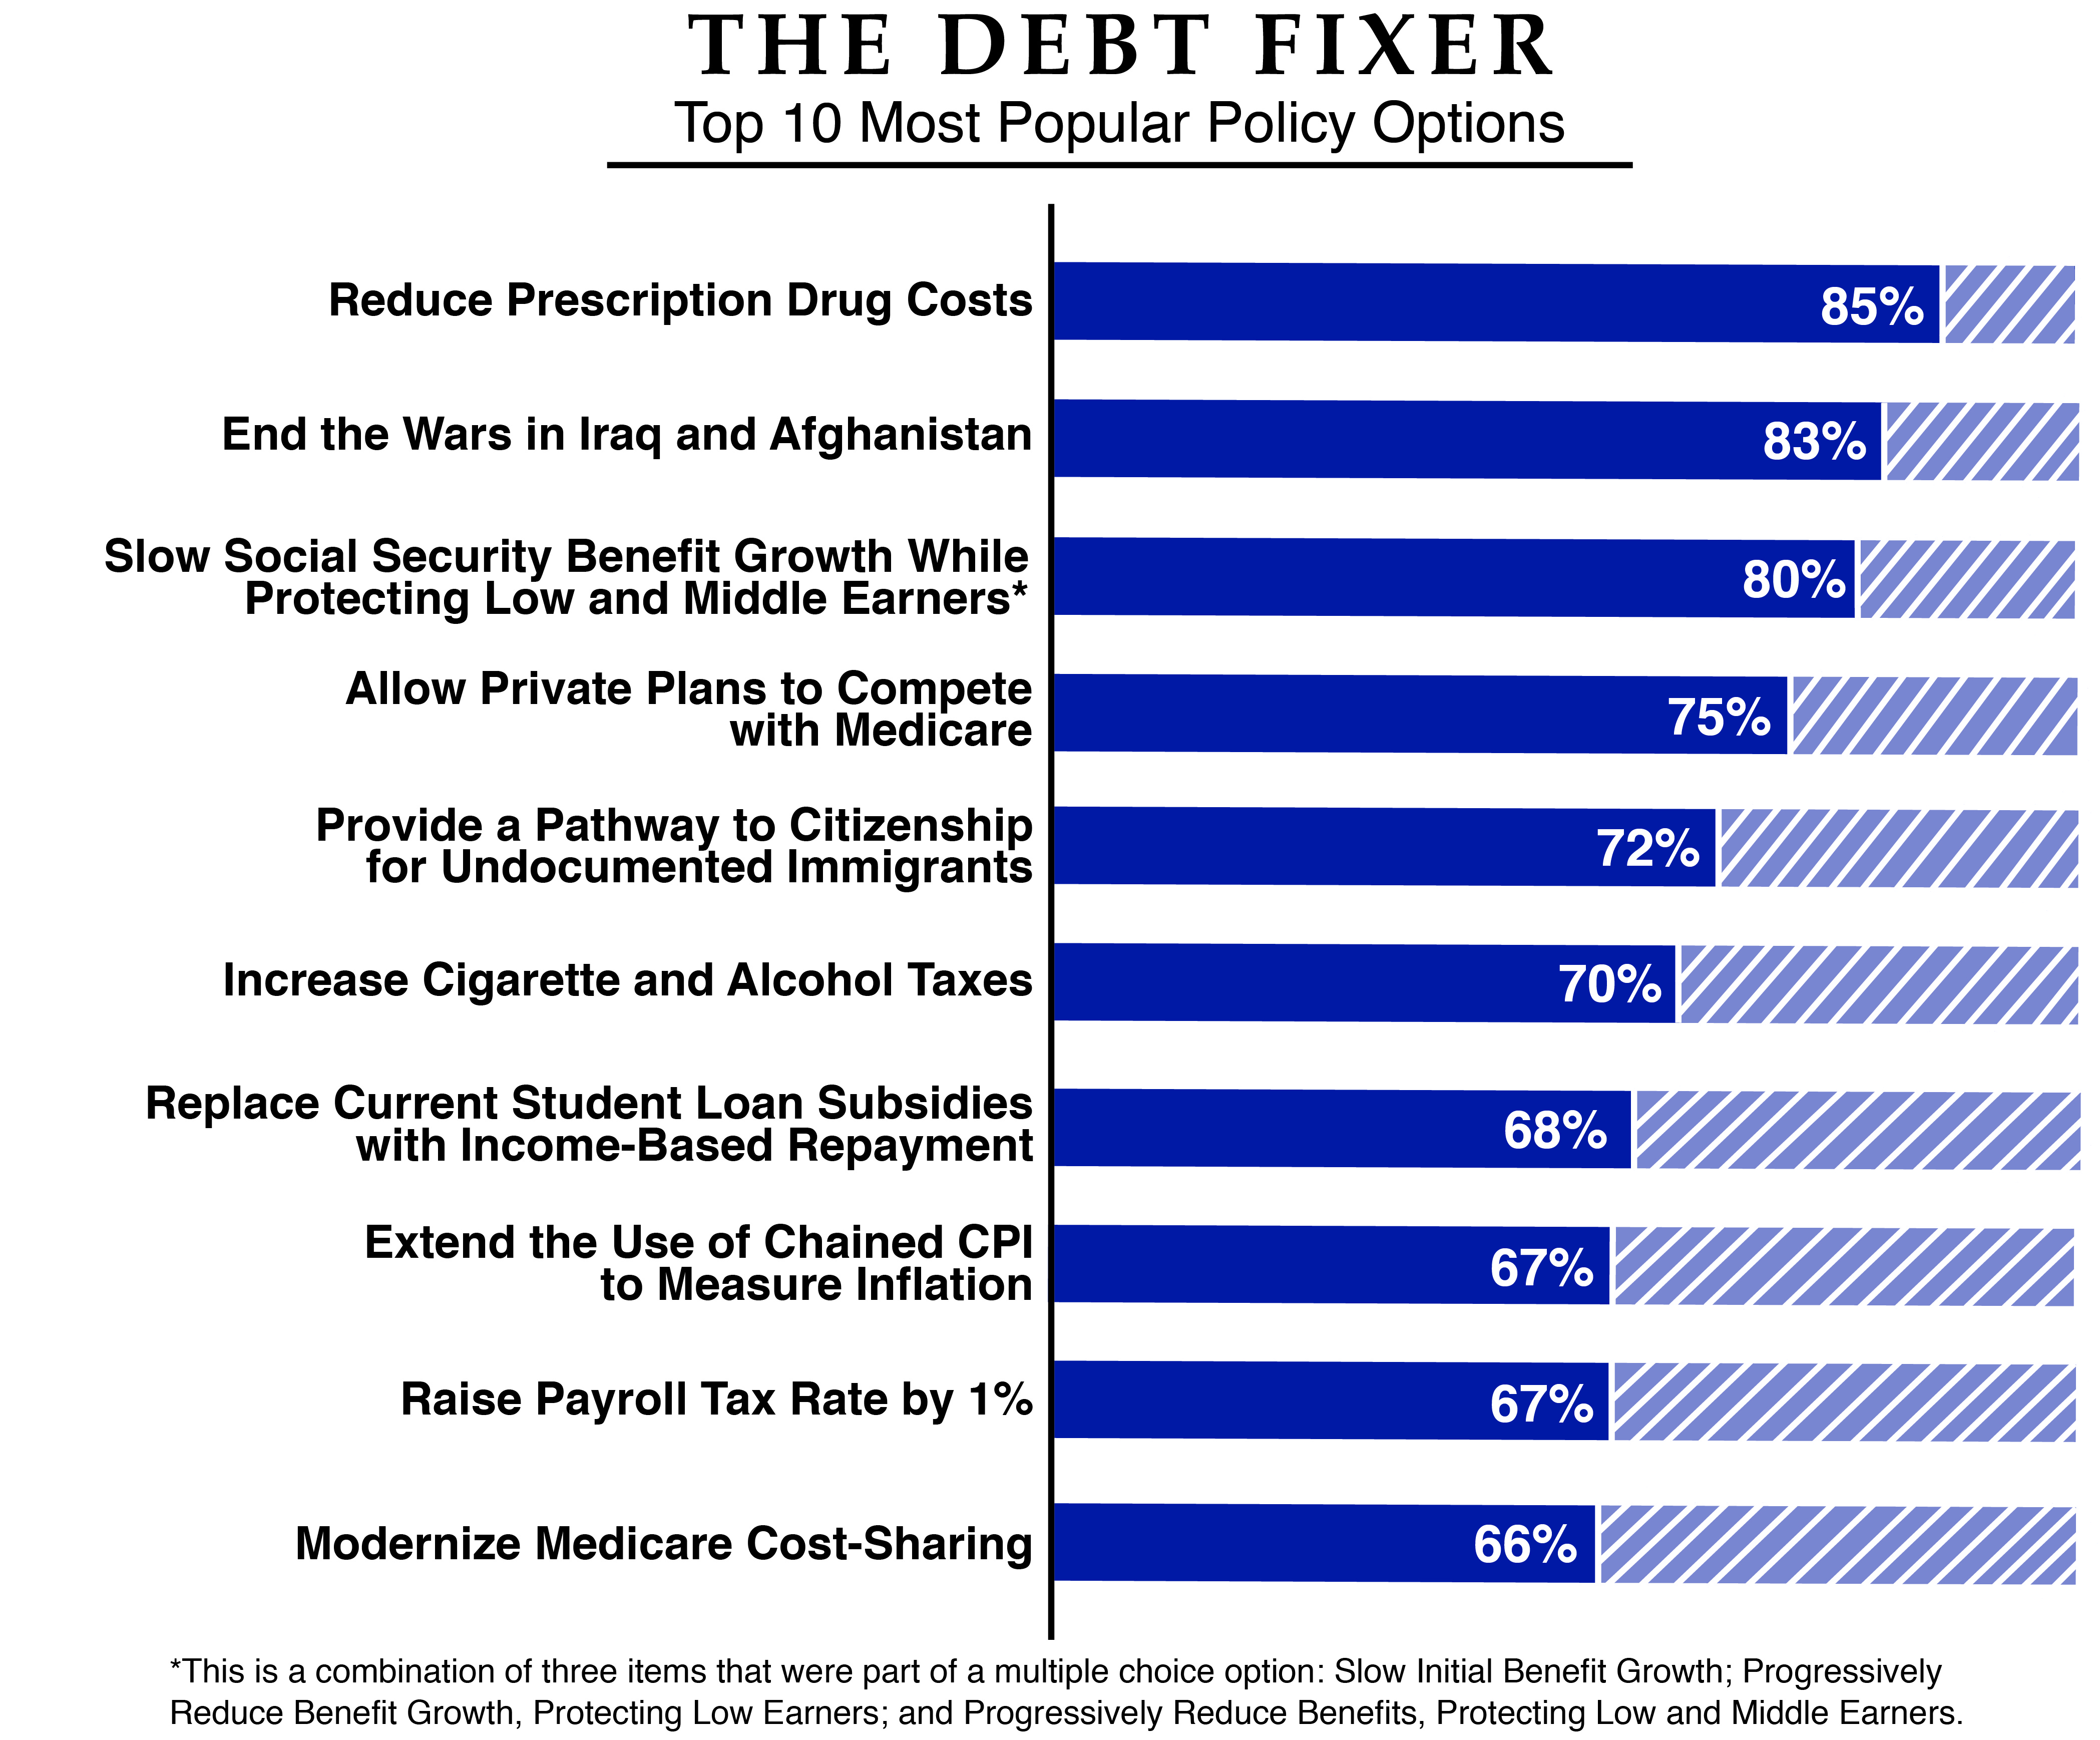
Appendix A of this paper includes the top 10 most and least popular policy choices made, while Appendix B includes all policies with majority support. Some notable findings include:
- The single most popular policy was reducing prescription drug costs, particularly in Medicare – it had 85 percent support.
- 83 percent of users chose to end the wars in the Middle East and Afghanistan.
- 63 percent of users elected to raise the Social Security Normal Retirement Age to 68, while 67 percent chose to use chained CPI to measure inflation for Social Security cost of living adjustments and other benefit programs.
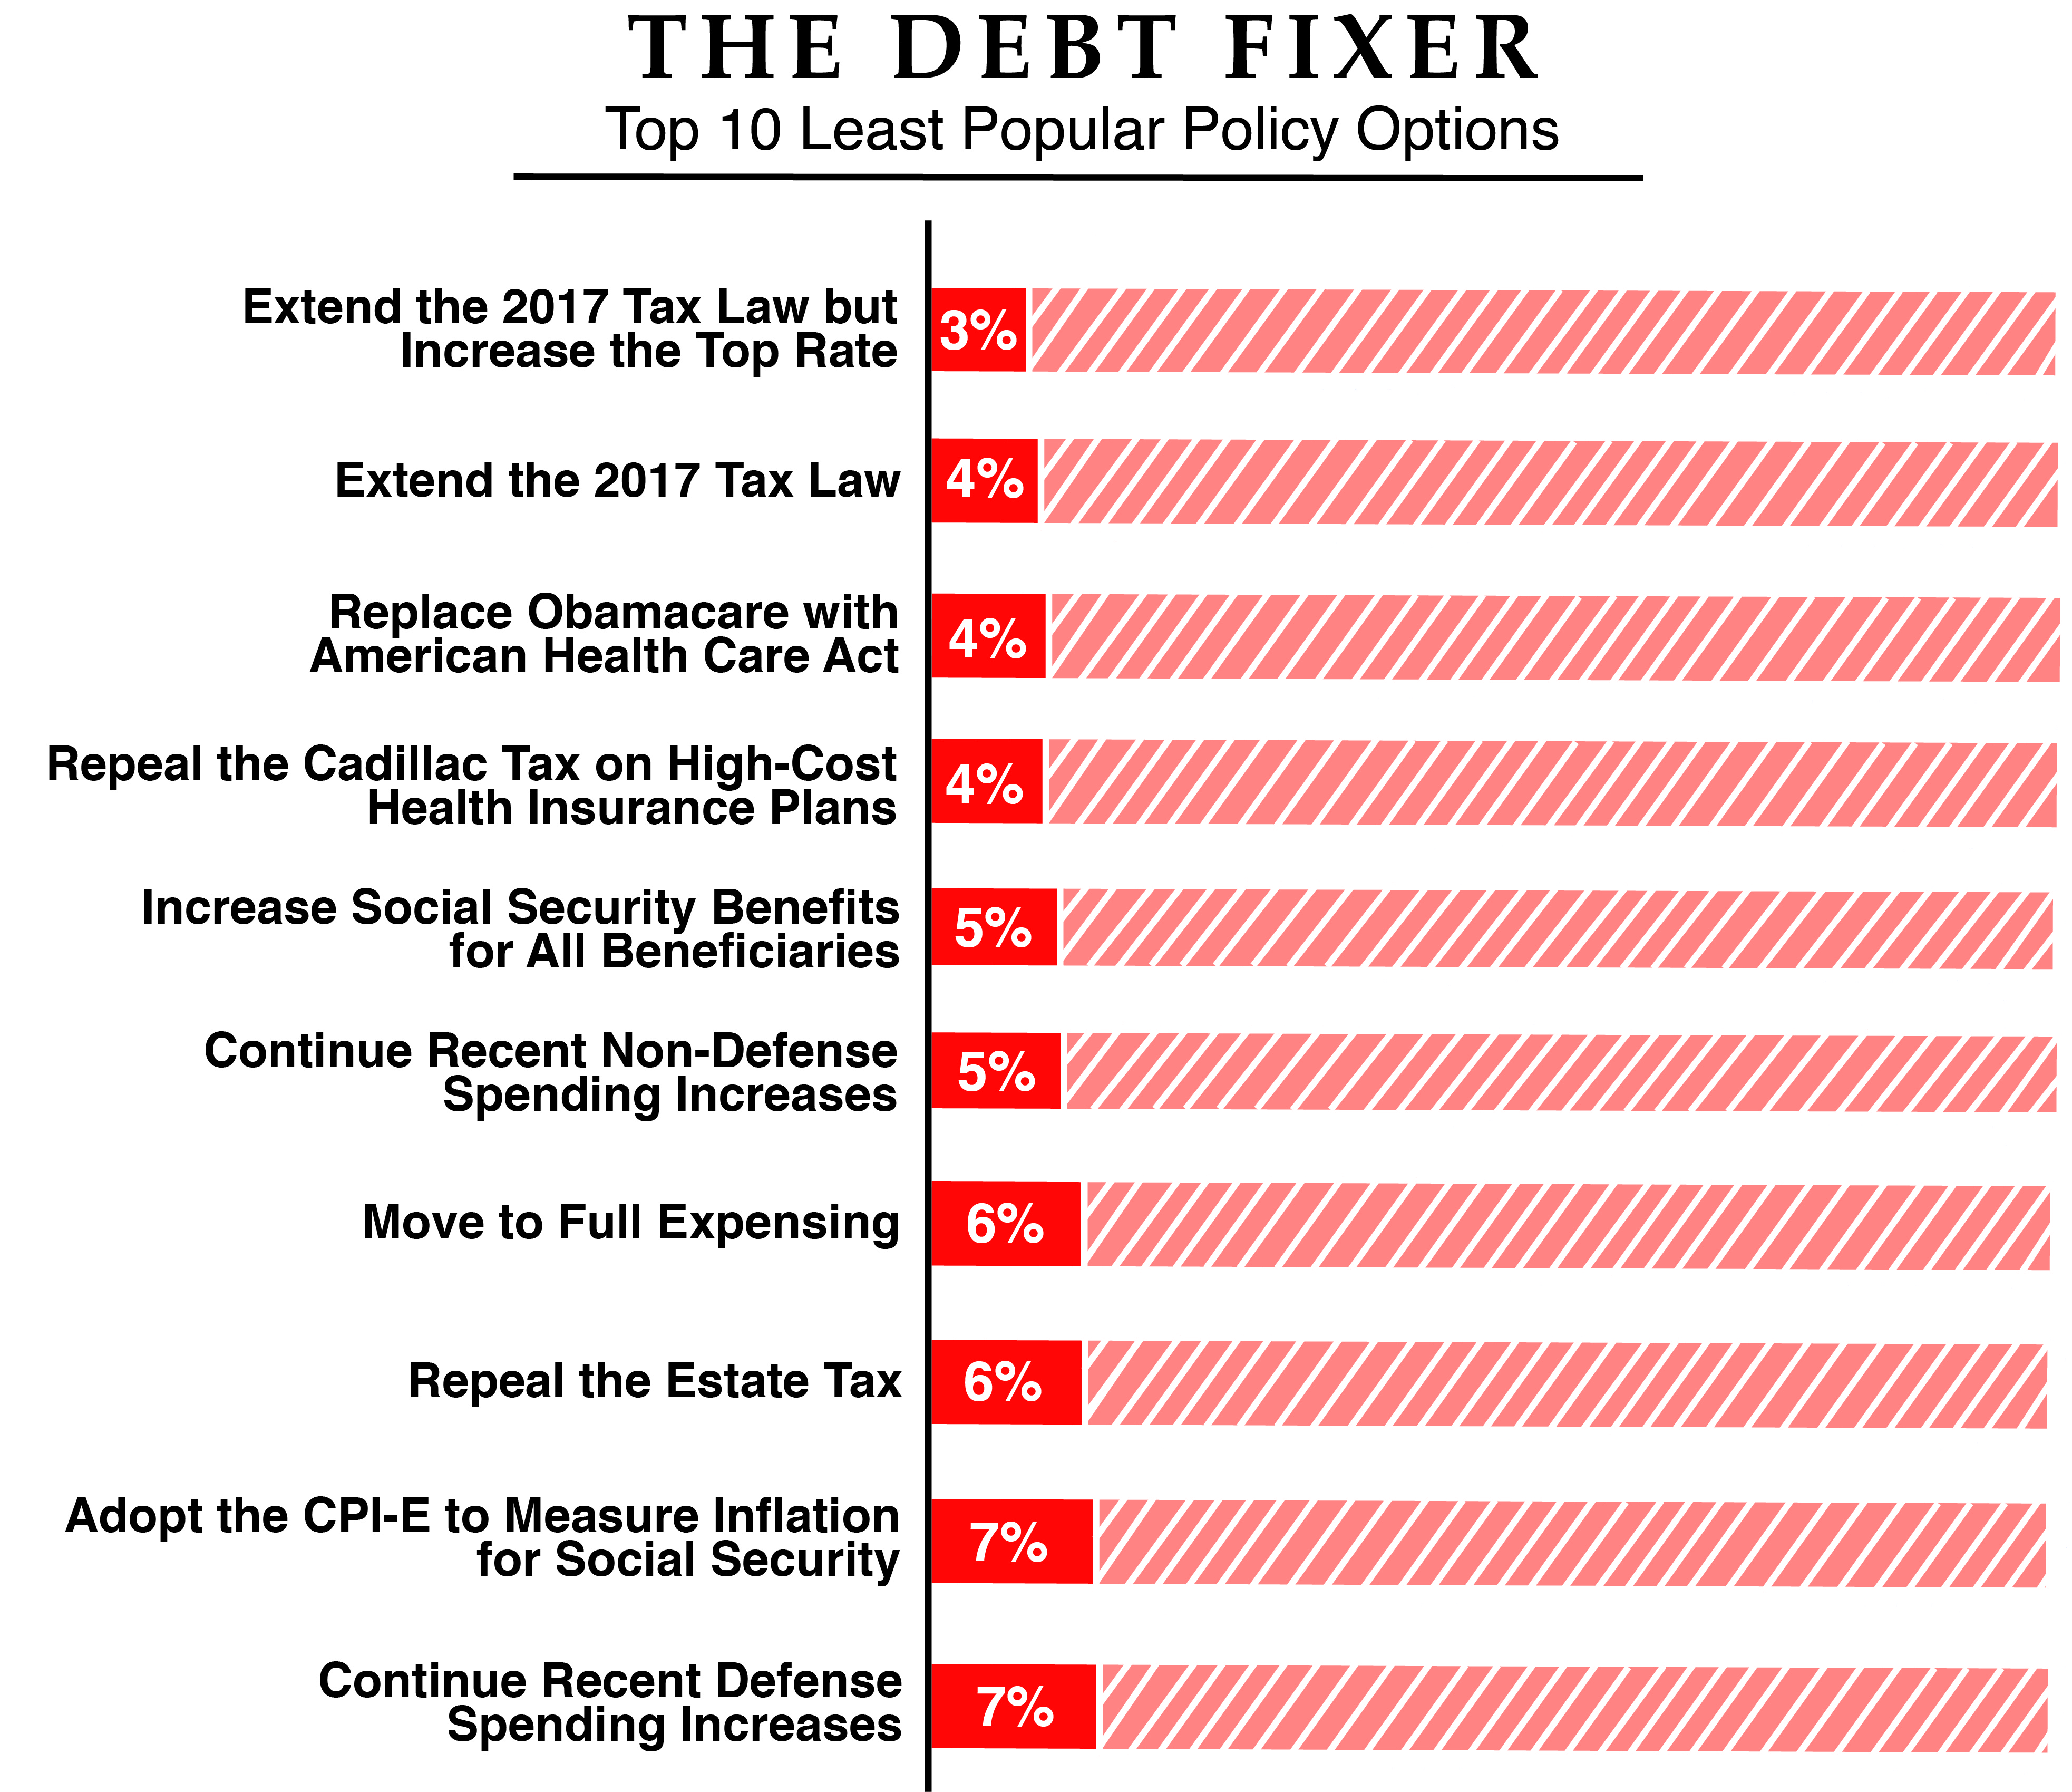
- While Congress is considering repealing the “Cadillac tax” on high-cost employer-sponsored health plans, only 4 percent of users chose that option. In fact, 59 percent elected to strengthen the policy by replacing the tax with a cap on the tax exemption for employer-paid health insurance programs.
- Repealing the Tax Cuts and Jobs Act was chosen by 49 percent of users. An additional 22 percent chose to extend the law but to undo all the individual rate cuts. Only four percent chose to permanently extend the law.
- 48 percent of users opted to limit the mortgage interest and charitable deductions, with support from Democrats, Republicans, and Independents evenly distributed.
- 18 percent of users selected an option to tighten border security and build a border wall, while 72 percent of users supported comprehensive immigration reform that included a path to citizenship.
- Only seven percent of users chose to continue the defense spending increases from the Bipartisan Budget Act of 2018 – a policy which was recently enacted into law.
- The Bipartisan Budget Act also increased non-defense discretionary spending by eliminating the sequester. Only five percent of users chose that option.
- Replacing Obamacare with the American Health Care Act was one of the least popular options at four percent, with little partisan difference between Republicans and Democrats.
User Demographics
Debt Fixer results were voluntarily submitted by 10,476 participants over the last 12 months. Of that population, 57 percent identified as male and 39 percent identified as female, with four percent not identifying. Democrats make up the largest plurality of respondents, accounting for 31 percent of the total population. Republicans accounted for 22 percent of respondents, with Independents behind them at 21 percent. More than a quarter of our participants – 26 percent – did not self-identify a political affiliation or answered “None.”
The unique feature of the Debt Fixer is that it does not measure popular support in a vacuum. Users see how their preferences will affect the larger budget picture. As a result, Americans are willing to make difficult political choices when they have a better understanding of the overall situation. These results also serve as a reminder that tough budget choices can be agreed upon by lawmakers of both parties.
The Debt Fixer is being used in classrooms and community budget exercises across the country. Request a dedicated link for your class or group to use or inquire about a budget exercise by contacting debtfixer@crfb.org.
Appendix A
Appendix B
What's Next
-

-
-
Image