Tax Day 2016: Charts to Explain our Tax System
Today is Tax Day! Our partners at Fix the Debt have republished their annual chartbook to explain federal taxes – including who pays them, what they pay for, and how they are collected. In addition, they look at the $1 trillion plus amount of tax expenditures in the tax code and how the revenue raised fits into the federal budget. We've highlighted a few of the charts below.

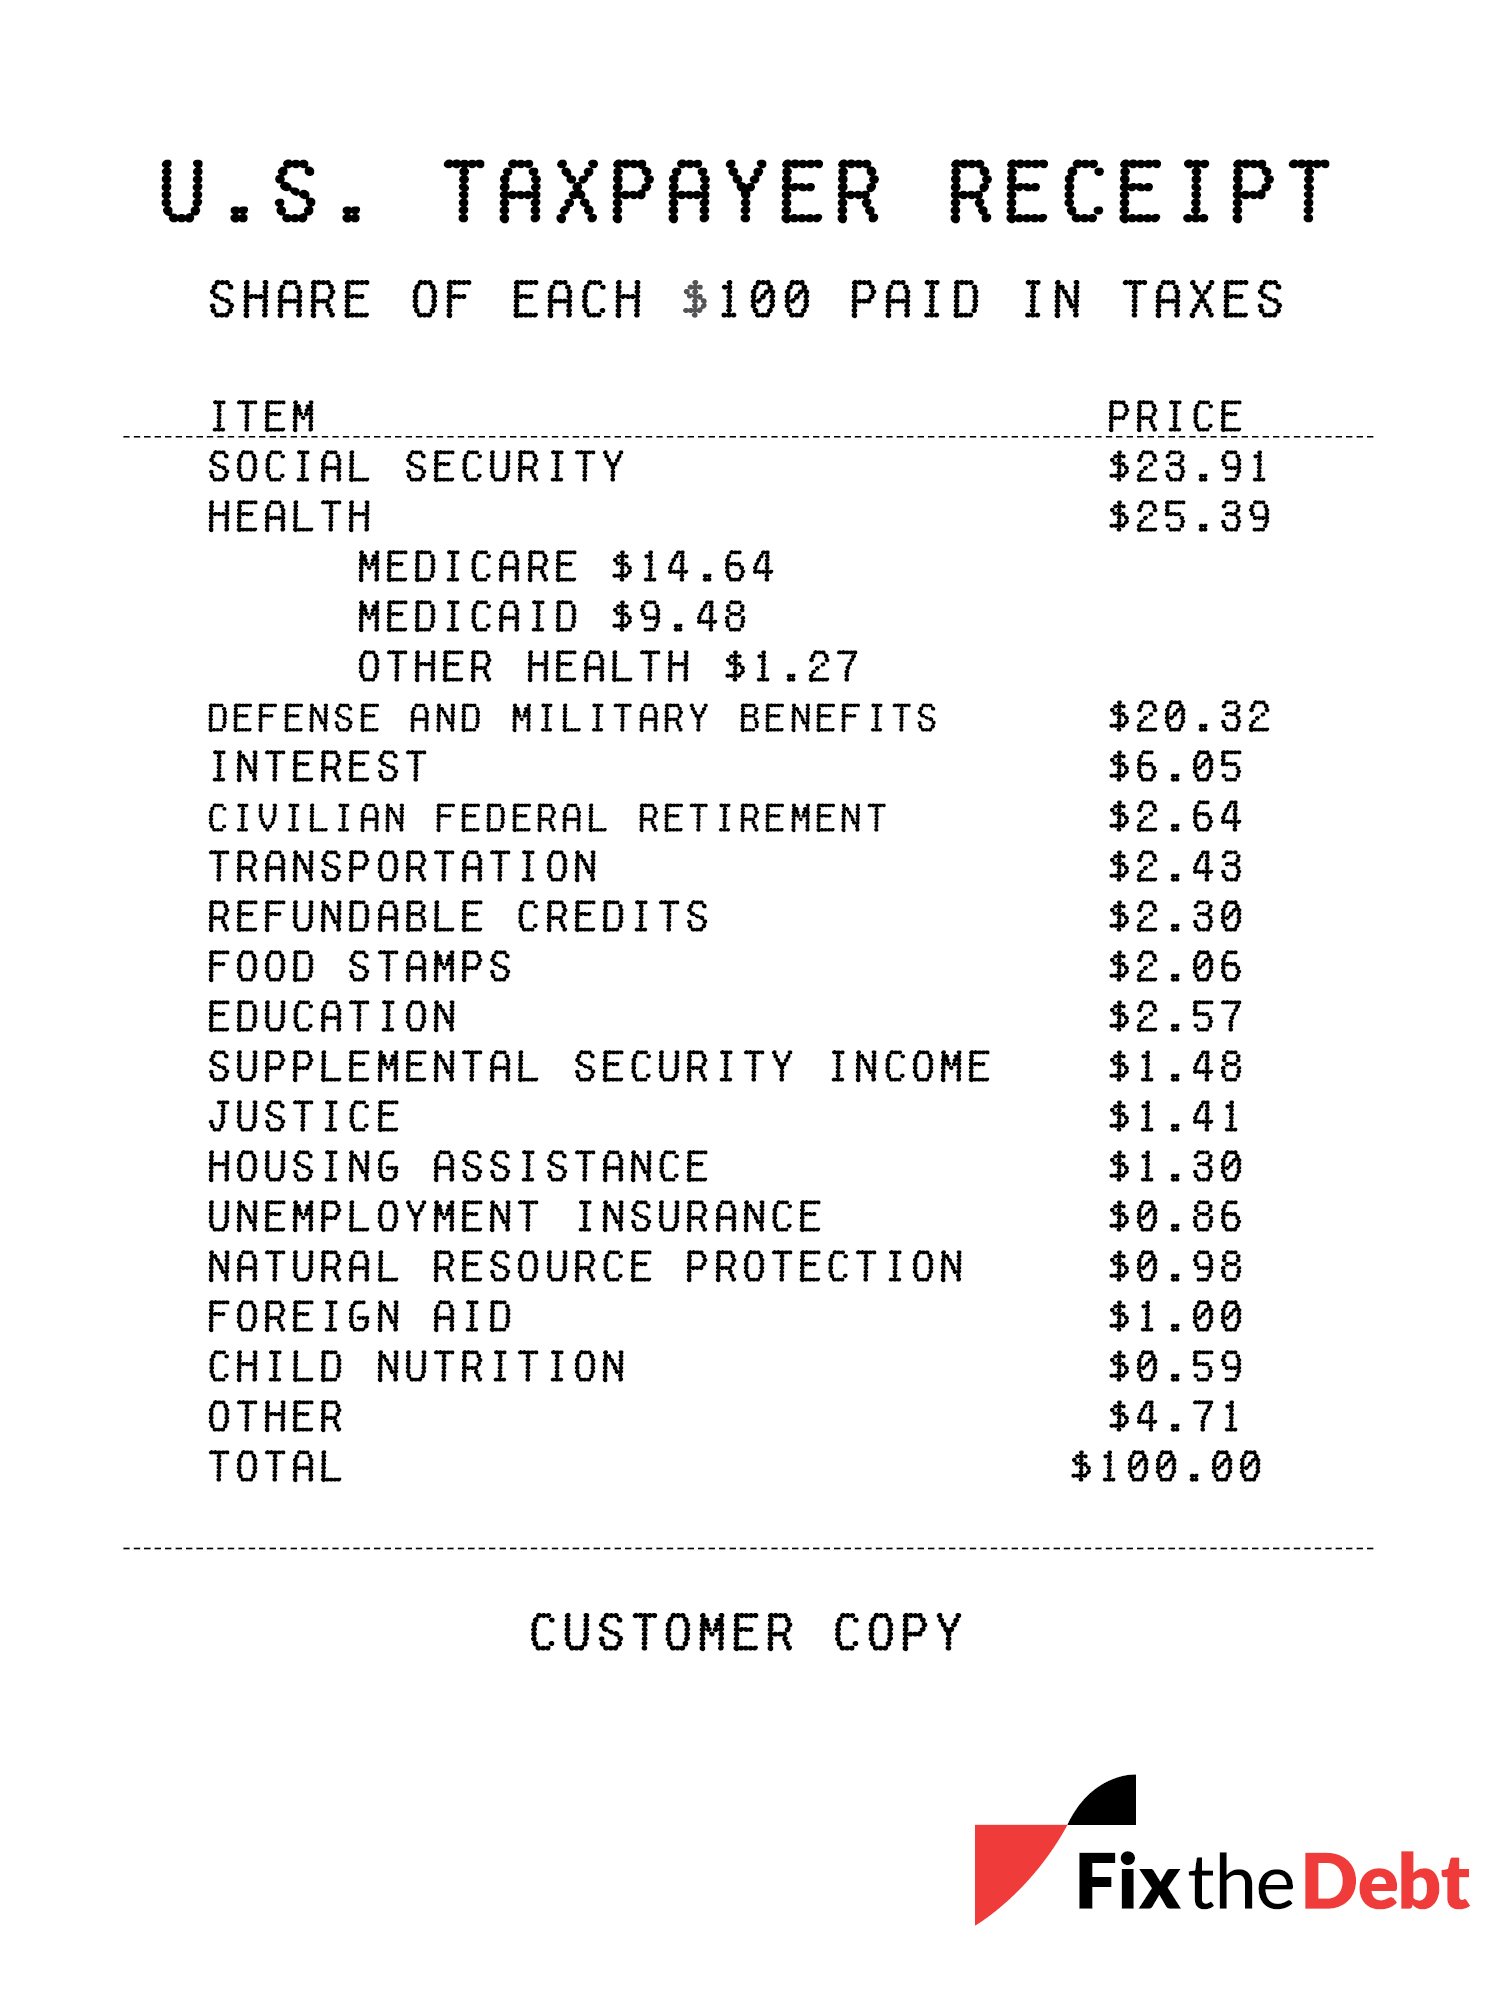
Where Tax Dollars Went In 2015
The taxpayer receipt for 2015 shows that a majority of tax dollars go towards Medicare, Social Security, and defense/military benefits. Relatively few tax dollars fund programs like foreign aid and natural resource protection. Notably, for every $100 paid in taxes, more than $6 goes towards the interest payments on the debt, making it the fourth-largest area of the budget. Because the government is running a deficit, federal taxes don’t cover all spending; taxpayers would have needed to pay an extra $13 for every $100 they spent in taxes to cover it all.
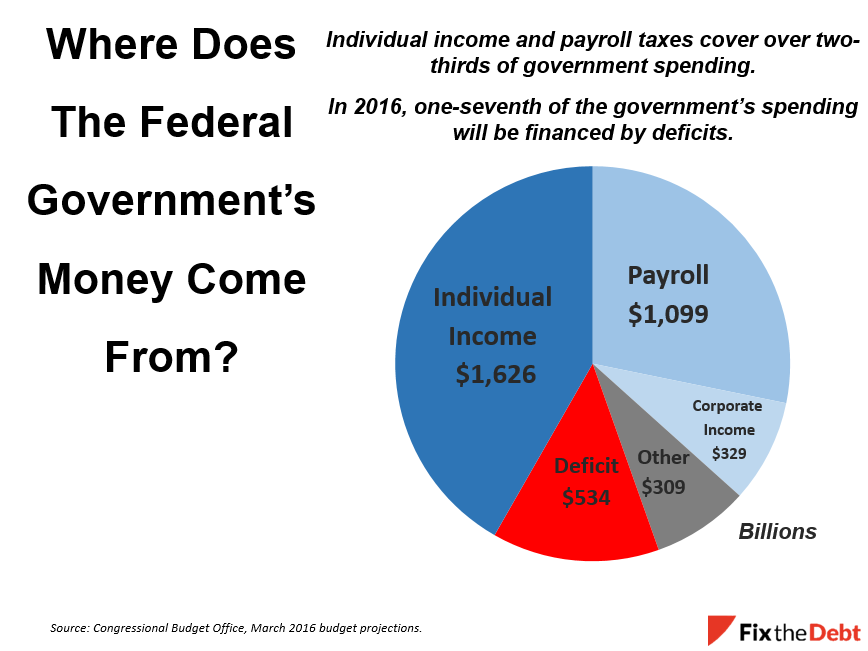
Where Does The Federal Government’s Money Come From?
The federal government collects most of its funds from individual income tax, payroll tax, and deficit financing. Individual income taxes and payroll taxes will cover 70 percent of this spending while 14 percent is deficit-financed. In the coming years, the government will increasingly rely on deficits unless our fiscal course is changed.
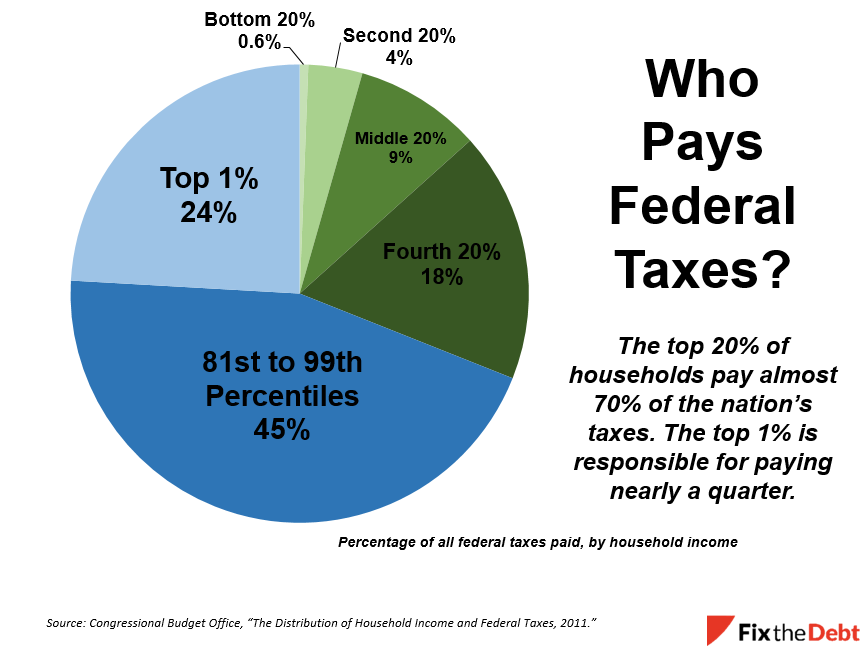
Who Pays Federal Taxes?
The top 20 percent of households pay almost 70 percent of federal taxes, with the top 1 percent of earners paying nearly one-quarter. This reflects both the distribution of income and the progressive nature of the current tax code: in 2011, households in the top income quintile received 52 percent of before-tax income and paid about 69 percent of federal taxes, while households in the bottom quintile received 5 percent of before-tax income and paid 0.6 percent of taxes.
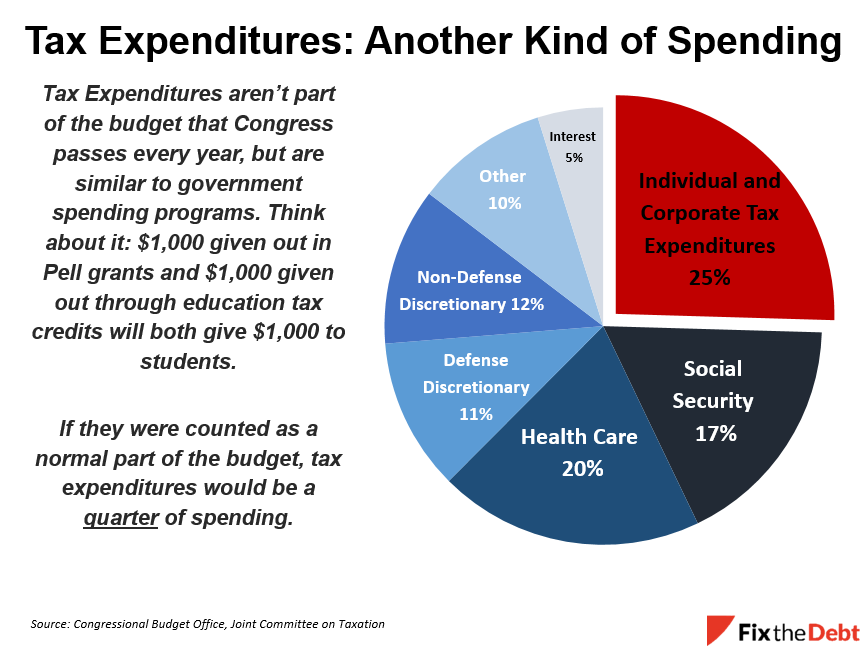
Tax Breaks Have Grown Over Time
The size of “tax expenditures” – the various deductions, credits, exclusions and other tax breaks in the current code – has grown over time, and is now twice as much as after lawmakers last reformed the tax code in 1986, after adjusting for inflation.
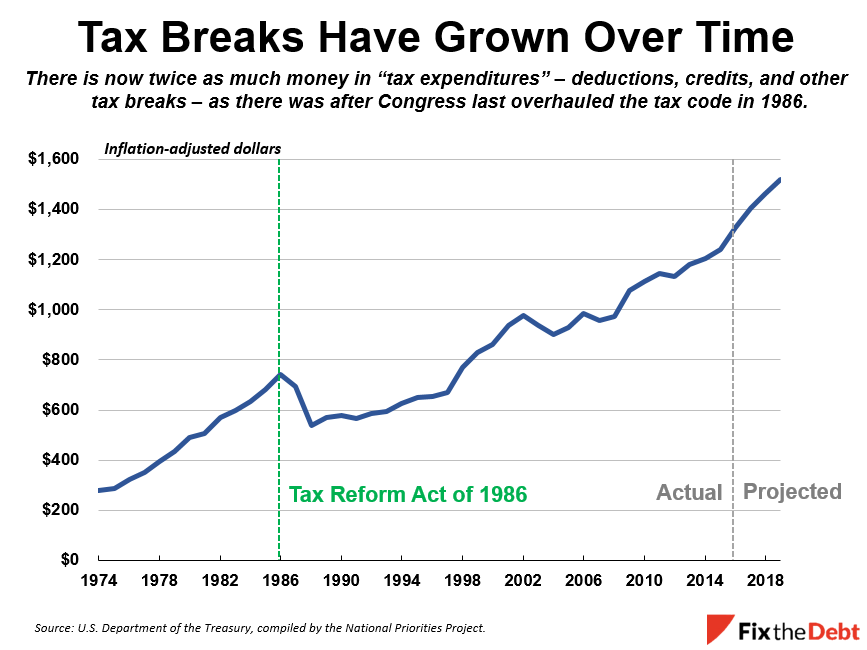
Many of these tax expenditures are similar to government spending programs. This leads some tax experts to refer to tax expenditures as “spending through the tax code” that obscures the true size of government. If individual and corporate tax expenditures were counted as ordinary spending, they collectively would comprise 25 percent of the federal budget.
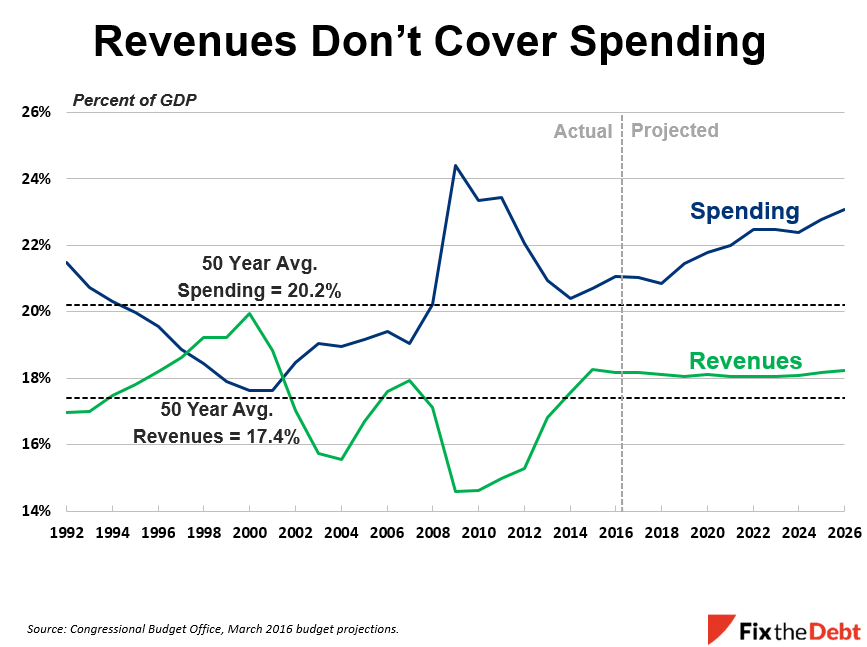
Revenues Don’t Cover Spending
Historically, revenues have averaged at 17.4 percent of GDP, while spending has averaged at 20.2
percent of GDP. Under current law, spending is expected to grow from 21.1 percent of GDP in 2016 to 23.1 percent by 2026, which is much higher than its historical average. Government will still have to rely heavily on deficit financing to meet its current spending obligations. On the other side, revenues are expected to remain virtually flat at around 18 percent of GDP.
Now that we've paid our taxes, it is worth remembering the basic facts about our current income tax system. And as lawmakers consider whether to overhaul the current tax code, it is important to recognize the tough choices and trade-offs inherent in tax reform.
Tags
What's Next
-
Image

-
Image

-
