The Social Security and Medicare Trustee Reports in Charts
The projections in the latest Medicare and Social Security Board of Trustees Report were further proof of the need to reform these important entitlement programs. But for some seeing is believing. Luckily, the Peter G. Peterson Foundation has produced a series of charts for Social Security and Medicare that capture the challenge we face.
Driven by a growing number of beneficiaries, the latest projections show cash flow deficits going forward. Social Security has been operating under a cash-flow deficit, spending more and more each year than it collects in payroll taxes (not including interest income from the trust fund). In 2012 alone, the program added $160 billion to the federal deficit, and the Trustees report only predicts this deficit value to increase. As seen in the graph below, without necessary action, accumulated deficits will exhaust all remaining trust fund reserves and force Social Security to run deeper and deeper deficits.

Source: Data from the SSA, ccompiled by PGPF
Fueling this deficit growth, as stated above, is the growth in Social Security beneficiaries. Aging U.S. demographics have pushed the worker to retiree ratio from 16 to 1 in 1950, to roughly 2.9 to 1 today, and it will shrink further as the population continues to age. Secondly, as illustrated in the graph below, Americans are living longer, increasing the length of time people are receiving Social Security benefits. The graph below shows how the Social Security Trustees have revised their life expectancy projections upward since 2008.
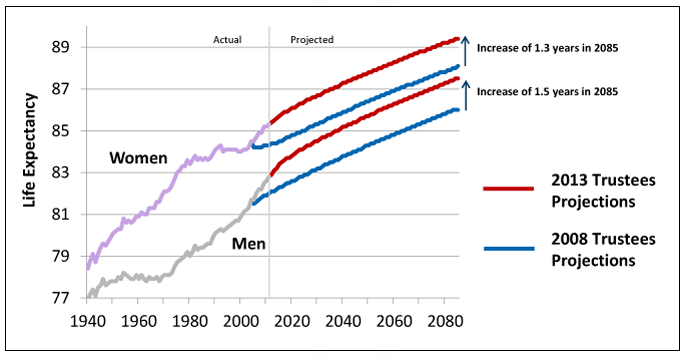
Source: Data from the SSA, ccompiled by PGPF
On Medicare, although the current Trustees projections indicated a slight decrease in the growth of healthcare costs, the program is still on an unsustainable path. Here, the Peterson Foundation's graph shows dramatic Medicare expenditure growth as a percent of GDP. This is particularly true under their alternate scenario where the Affordable Care Act cost-reduction measures are not sustainable and are repealed: total cost-expenditures could rise to nearly 10 percent of GDP by 2080.
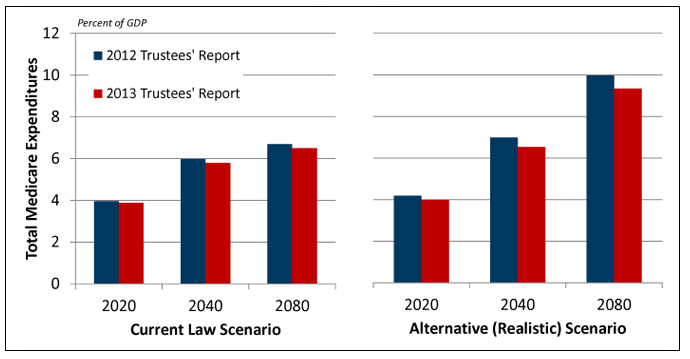
Source: Data from the Medicare Trustees, compiled by PGPF
As can be clearly seen, our Social Security and Medicare programs are on a unsustainable path. The Peterson Foundation's illustrations helpfully demonstrate this, showing both the past and projected growth of these programs and what will happen if we do not act to reform them.