A Quick Summary of President Trump's FY 2018 Budget
Today, President Trump released his Fiscal Year (FY) 2018 budget, the first full budget proposal of his presidency. We will publish a full analysis soon, but this blog provides an overview of the budget and its highlights. Stay tuned to CRFB and The Bottom Line throughout the day and the rest of the week as we take closer looks at all aspects of the President’s FY 2018 budget.
Encouragingly, the President's budget sets a fiscal goal (balancing the budget by 2027) that puts the debt on a sustainable downward path, and he identifies a number of real and serious spending cuts to help meet that goal. However, we are deeply disappointed that to achieve this fiscal goal, President Trump relies on incredibly rosy economic growth estimates that we've shown are highly unlikely to occur, along with deep unspecified future discretionary spending cuts. Disappointingly, the budget also omits any estimate of a tax reform agenda that could be quite costly and, based on past statements from the Administration, would in part be paid for with economic growth feedback that the budget is currently counting on for deficit reduction.
Below, we discuss the basics of President Trump's FY 2018 budget:
Deficits and Debt in the President's Budget
Relative to the Office of Management and Budget's (OMB) baseline (which includes higher economic growth), the President's budget reduces primary spending by $4.23 trillion over the next decade, reduces revenue by $990 billion, and reduces interest costs by $323 billion. The result is $3.56 trillion in deficit reduction over the next decade, including $858 billion in 2027 alone. On top of these programmatic savings, the budget also assumes roughly $2.06 trillion in deficit reduction (built into its baseline) from greater economic growth, including $496 billion in 2027.
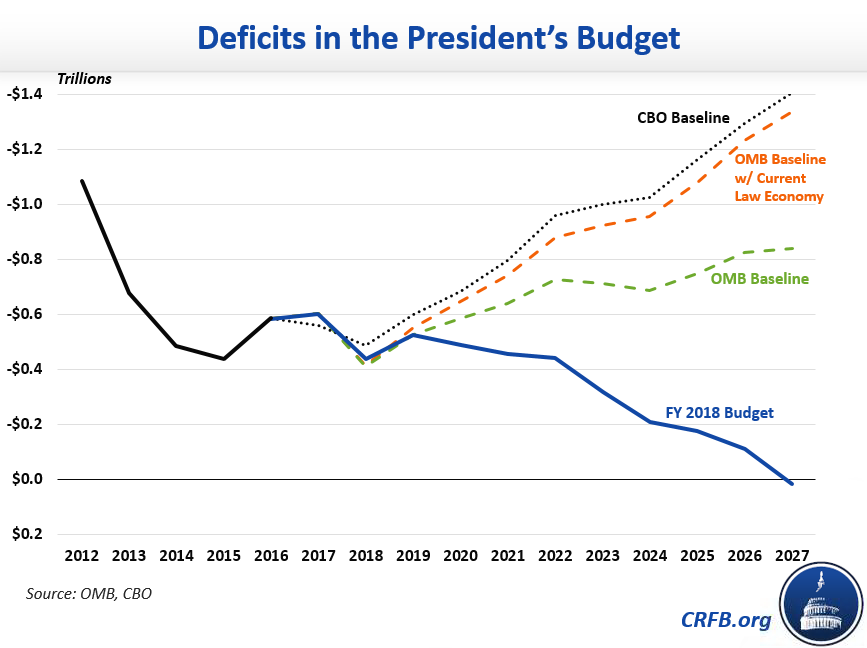
As a result of this deficit reduction, deficits would fall from $585 billion (3.2 percent of Gross Domestic Product) in 2016 to $442 billion (1.8 percent of GDP) in 2022, and turn into a small surplus of $16 billion by 2027. By comparison, OMB's baseline projects deficits of $842 billion in 2027, or $1.34 trillion before incorporating the assumed economic effects of the President's budget. The Congressional Budget Office (CBO) projects deficits of $1.4 trillion in 2027.
As a result of declining deficits and rapid growth projections, OMB projects debt as a share of GDP to fall precipitously under their budget. Specifically, OMB projects debt under the President's budget to fall from 77 percent of GDP today to below 60 percent of GDP by 2027 – the lowest it has been since 2009. By comparison, OMB's baseline projects debt reaching 71 percent of GDP in 2027, or 85 percent before incorporating the assumed economic effects of the President's budget (OMB's pre-policy baseline). CBO projects debt will rise to 89 percent.
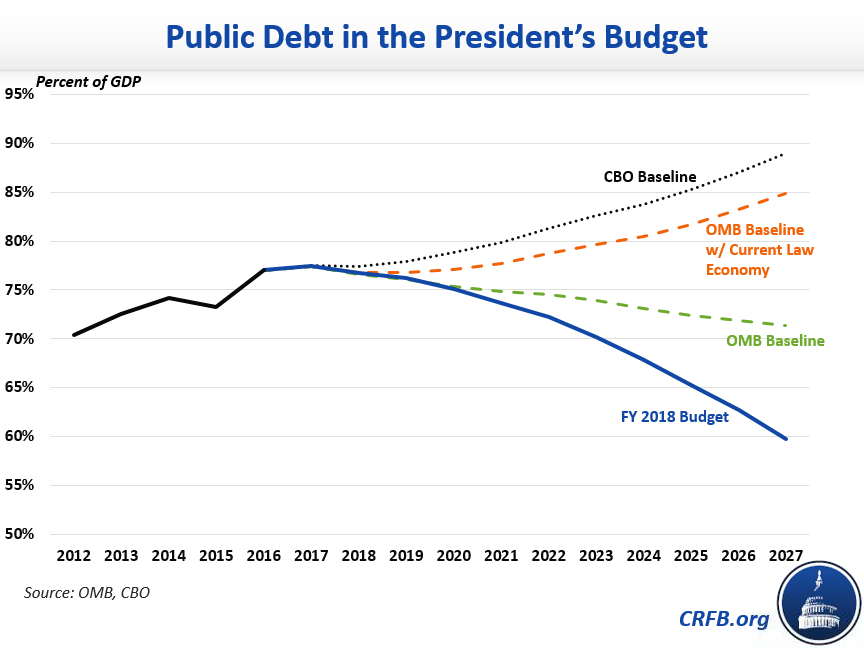
Importantly, the massive reduction in the debt-to-GDP ratio under the President's budget is largely driven by the budget's rosy economic assumptions.
Spending and Revenue in the President's Budget
The President's budget includes $4.55 trillion in total spending reductions ($4.23 trillion of primary spending cuts and $323 billion of interest savings). Among the largest of these cuts includes $1.25 trillion from repealing and replacing the Affordable Care Act (ACA or "Obamacare"), $1.4 trillion from reductions in non-defense discretionary spending, $616 billion from reforms to Medicaid and the Children's Health Insurance Program (CHIP) in addition to those in ACA repeal, and $272 billion from reforming various income security programs, among other spending cuts throughout the non-health, non-Social Security mandatory budget. These cuts are partially offset by roughly $470 billion in increased defense spending, $200 billion in infrastructure spending, and several other new spending items.
The President's budget also includes $990 billion in net revenue loss as a result of the tax cuts and revenue reductions from repealing and replacing the Obamacare taxes and mandates. The budget assumes deficit neutral tax reform, but does not mention any new provisions besides those included in the Administration's previously released tax reform framework – which we estimated could cost as much as $5.5 trillion if additional base-broadening provisions are not included.
As a result of these changes, along with faster assumed economic growth, OMB estimates spending under the budget will fall while revenue rises. Specifically, outlays fall from 21.2 percent of GDP in 2017 to 19.9 percent in 2022 and 18.4 percent by 2027. Revenues, meanwhile, rise from 18.1 percent of GDP in 2017 to 18.4 percent in 2027.
The Key Numbers in the President's Budget
| 2016 | 2017 | 2018 | 2019 | 2020 | 2021 | 2022 | 2023 | 2024 | 2025 | 2026 | 2027 | Ten-Year | |
|---|---|---|---|---|---|---|---|---|---|---|---|---|---|
| Revenue | |||||||||||||
| $ (trillions) | $3.27 | $3.46 | $3.66 | $3.81 | $3.98 | $4.16 | $4.39 | $4.62 | $4.86 | $5.13 | $5.42 | $5.72 | $45.75 |
| % of GDP | 17.8% | 18.1% | 18.3% | 18.2% | 18.1% | 18.0% | 18.1% | 18.1% | 18.2% | 18.2% | 18.3% | 18.4% | 18.2% |
| Outlays | |||||||||||||
| $ (trillions) | $3.85 | $4.06 | $4.09 | $4.34 | $4.47 | $4.62 | $4.83 | $4.93 | $5.07 | $5.31 | $5.53 | $5.71 | $48.90 |
| % of GDP | 20.9% | 21.2% | 20.5% | 20.7% | 20.3% | 20.0% | 19.9% | 19.4% | 18.9% | 18.9% | 18.7% | 18.4% | 19.6% |
| Deficit | |||||||||||||
| $ (billions) | $585 | $603 | $440 | $526 | $488 | $456 | $442 | $319 | $209 | $176 | $110 | -$16 | $3,150 |
| % of GDP | 3.2% | 3.1% | 2.2% | 2.5% | 2.2% | 2.0% | 1.8% | 1.3% | 0.8% | 0.6% | 0.4% | -0.1% | 1.4% |
| Public Debt | |||||||||||||
| $ (trillions) | $14.17 | $14.82 | $15.35 | $15.96 | $16.51 | $17.02 | $17.52 | $17.89 | $18.15 | $18.38 | $18.54 | $18.58 | N/A |
| % of GDP | 77.0% | 77.4% | 76.7% | 76.2% | 75.1% | 73.7% | 72.2% | 70.2% | 67.8% | 65.3% | 62.7% | 59.8% | N/A |
We expect these number will differ dramatically when re-scored by CBO – and in future analysis we will aim to quantify some of the possible differences.
Policies in the Budget
The below table outlines the major policy proposals in the President's budget and OMB's estimated savings:
| Policy | Claimed Savings |
|---|---|
| Repeal and replace the Affordable Care Act | $250 billion |
| Support $1 trillion in private/public infrastructure investment | -$200 billion |
| Reform financial regulations | $35 billion |
| Established a paid parental leave program | -$19 billion |
| Reform Medicaid and CHIP | $616 billion |
| Reform the welfare system | $272 billion |
| Reform federal student loans | $143 billion |
| Reduce improper payments | $142 billion |
| Reform disability programs | $72 billion |
| Reform retirement benefits for federal employees | $63 billion |
| Limit Farm Bill subsidies and make other agriculture reforms | $38 billion |
| Extend the Veterans Choice program | -$29 billion |
| Other spending reductions and program reforms | $339 billion |
| Eliminate the defense sequester and raise the cap on defense spending | -$469 billion |
| Reorganize government and apply two-penny plan to non-defense discretionary spending | $1,404 billion |
| Phase down the use of Overseas Contingency Operations funding | $593 billion |
| Subtotal | $3,252 billion |
| Debt service and indirect interest effects | $311 billion |
| Total Policy Savings | $3,563 billion |
| Effect of economic feedback | $2,062 billion |
| Total Savings | $5,625 billion |
We will publish a more detailed analysis of the President’s FY 2018 budget later today and over the course of the week. All of our papers and blogs on the budget will be collected here. Our analyses of past budgets can be found here.
What's Next
-
Image

-
Image
-
Image