Report: Analysis of CBO's August 2016 Budget and Economic Outlook
Budget deficits are on the rise, according to the Congressional Budget Office’s (CBO’s) budget and economic projections released today. CBO projects that this year’s deficit will total $590 billion – roughly 35 percent higher than last year’s deficit of $438 billion – and trillion-dollar deficits will return by 2024 under current law. CBO also found the following:
- Deficits will grow dramatically over the next decade, rising from $590 billion, or 3.2 percent of Gross Domestic Product (GDP), in 2016 to $1.2 trillion, or 4.6 percent of GDP, in 2026.
- Debt held by the public will grow by over $9 trillion between now and 2026, from over $14 trillion today to $23.1 trillion by 2026. As a share of GDP, debt will rise from its post-World War II era high of 77 percent in 2016 to nearly 86 percent by 2026.
- Spending will grow from 21.1 percent of GDP in 2016 to 23.1 percent in 2026, while revenues will rise from 17.8 percent in 2016 to 18.5 percent by 2026.
- Of the nearly $2.4 trillion of nominal spending growth between 2016 and 2026, 82 percent will come from Social Security, health care, and interest on the debt. Those three budgetary categories will rise in cost from $2.2 trillion (11.8 percent of GDP) in 2016 to $4.1 trillion (15.3 percent of GDP) in 2026.
- CBO’s debt-to-GDP projections are similar to those made in March. While CBO projects $555 billion less in nominal debt by 2026 as a result of lower projected interest rates, this is offset by a projected $633 billion lower GDP estimate.
- We project under the assumptions of CBO’s Alternative Fiscal Scenario, where Congress extends various expiring tax cuts and eliminates the sequester, debt would reach 92 percent of GDP by 2026.
CBO’s latest projections clearly show that deficits are no longer declining and that the nation’s fiscal outlook remains bleak and unsustainable. As CBO explains, “Such high and rising debt would have serious negative consequences for the budget and the nation.” Given these projections, it is particularly discouraging that neither presidential candidate has a serious proposal to slow the growth in the debt (with Donald Trump set to dramatically increase it) and that outside commentators have been calling on policymakers to add more borrowing to an already large and growing debt burden.
Budget Projections
Under current law, CBO expects debt held by the public to continue to rise from today’s post–World War II era record-high levels. Under current law, CBO projects debt will rise from 73.6 percent of GDP in 2015 to 76.6 percent in 2016, 78.4 percent in 2020 and 85.5 percent in 2026. In dollar terms, debt will rise from $13.1 trillion at the end of 2015 to $14.1 trillion at the end of 2016, $16.8 trillion at the end of 2020, and $23.1 trillion by the end of 2026.
Fig. 1: Debt Held by the Public (Percent of GDP)
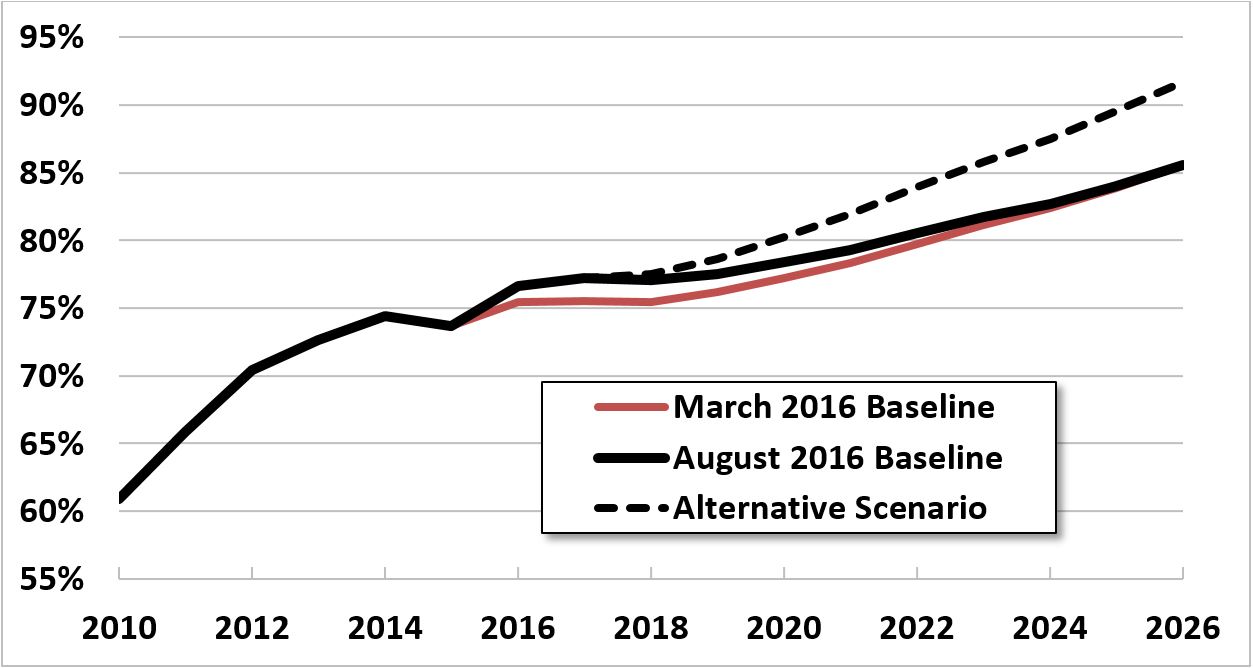
Source: CBO and CRFB calcuations.
Rising debt levels are the result of continued increases in deficits. After declining between 2009 (when it was at post–World War II era record high) and 2015, the deficit is projected to rise by more than one-third this year, from $438 billion to $590 billion. By 2024, CBO projects trillion dollar deficits to return, and by 2026 they will exceed $1.2 trillion.
As a share of economy, CBO projects deficits will remain roughly stable at around 3 percent of GDP through 2020 (up from 2.5 percent in 2015), and then rise significantly to 4.6 percent by 2026. Thought of another way, deficits will almost double as a share of GDP and triple in nominal dollars between 2015 and 2026. Outside of the Great Recession and its immediate aftermath, the 2026 deficit will be the highest ever in nominal dollars and the fifth-highest deficit as a share of GDP since World War II.
Fig. 2: Trillion-Dollar Deficits Set to Return by 2024 (billions)
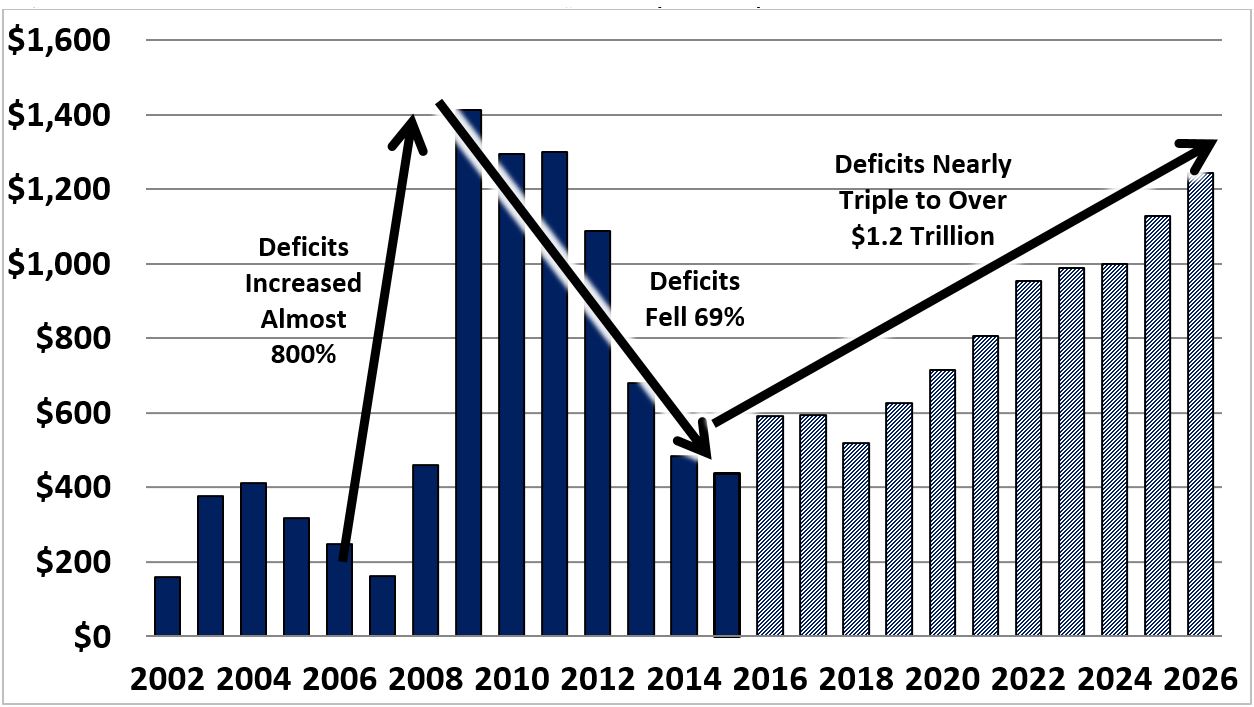
Source: CBO and CRFB calcuations.
The return of rising deficits is driven by spending growth that CBO projects will significantly exceed growth in revenues. As a share of the economy, spending will rise from 20.7 percent of GDP in 2015 to 23.1 percent in 2026. Revenue will remain stable around 18 percent of GDP through the first half of the next decade and rise to 18.5 percent by 2026.
The vast majority of spending growth over the next decade is a result of rising costs for health care, Social Security, and interest on the debt. These three categories are responsible for 82 percent of nominal spending growth over the next decade and 170 percent of spending growth as a share of GDP (with other budget categories shrinking). CBO projects Social Security will grow from 5.0 percent of GDP in 2016 to 6.0 percent by 2026, federal health spending from 5.5 percent to 6.7 percent, and interest from 1.4 percent to 2.6 percent.
On the revenue side, individual income taxes will increase as a share of GDP over time from 8.7 percent in 2015 to 9.8 percent by 2026. However, payroll tax, corporate tax, and other revenue collection will decline from 9.6 to 8.7 percent of GDP, mostly offsetting income tax gains.
Importantly, the gap between spending and revenue will be much worse if Congress continues to pass costly legislation without offsets. For example, if Congress extends expiring tax provisions, continues to delay various taxes from the Affordable Care Act, and enacts an unpaid-for repeal of the automatic spending reductions known as ‘the sequester,’ spending would rise to 23.6 percent of GDP by 2026 (as opposed to 23.1), and revenue would remain at 18.2 percent of GDP by 2026 (as opposed to rising to 18.5), leaving a deficit of 5.4 percent of GDP and debt in excess of 92 percent of GDP in 2026 (instead of 4.6 percent and 85.5 percent, respectively).
Fig. 3: Comparing CBO's August and March 2016 Budget Projections
| 2016 | 2017 | 2018 | 2019 | 2020 | 2021 | 2022 | 2023 | 2024 | 2025 | 2026 | Ten-Year* | ||
|---|---|---|---|---|---|---|---|---|---|---|---|---|---|
| REVENUES (Percent of GDP) | |||||||||||||
| Aug. 2016 Baseline | 17.8% | 17.9% | 18.1% | 18.1% | 18.2% | 18.2% | 18.3% | 18.3% | 18.3% | 18.4% | 18.5% | 18.3% | |
| Mar. 2016 Baseline | 18.2% | 18.2% | 18.1% | 18.0% | 18.1% | 18.1% | 18.1% | 18.1% | 18.1% | 18.2% | 18.2% | 18.1% | |
| OUTLAYS (Percent of GDP) | |||||||||||||
| Aug. 2016 Baseline | 21.1% | 21.0% | 20.7% | 21.2% | 21.6% | 21.9% | 22.4% | 22.4% | 22.3% | 22.7% | 23.1% | 22.0% | |
| Mar. 2016 Baseline | 21.1% | 21.0% | 20.8% | 21.4% | 21.8% | 22.0% | 22.5% | 22.5% | 22.4% | 22.8% | 23.1% | 22.1% | |
| DEFICITS (Percent of GDP) | |||||||||||||
| Aug. 2016 Baseline | 3.2% | 3.1% | 2.6% | 3.0% | 3.3% | 3.6% | 4.1% | 4.1% | 4.0% | 4.3% | 4.6% | 3.8% | |
| Mar. 2016 Baseline | 2.9% | 2.8% | 2.7% | 3.4% | 3.7% | 3.9% | 4.4% | 4.4% | 4.3% | 4.6% | 4.9% | 4.0% | |
| DEBT (Percent of GDP) | |||||||||||||
| Aug. 2016 Baseline | 76.6% | 77.2% | 77.0% | 77.5% | 78.4% | 79.3% | 80.5% | 81.7% | 82.7% | 84.0% | 85.5% | N/A | |
| Mar. 2016 Baseline | 75.4% | 75.5% | 75.4% | 76.2% | 77.2% | 78.3% | 79.8% | 81.2% | 82.4% | 83.9% | 85.6% | N/A | |
| DEFICITS (in Billions of Dollars) | |||||||||||||
| Aug. 2016 Baseline | $590 | $594 | $520 | $625 | $714 | $806 | $954 | $988 | $1,000 | $1,128 | $1,243 | $8,571 | |
| Mar. 2016 Baseline | $534 | $550 | $549 | $710 | $798 | $890 | $1,043 | $1,080 | $1,094 | $1,226 | $1,343 | $9,283 | |
| DEBT (in Trillions of Dollars) | |||||||||||||
| Aug. 2016 Baseline | $14.1 | $14.7 | $15.3 | $16.0 | $16.8 | $17.6 | $18.6 | $19.6 | $20.6 | $21.8 | $23.1 | N/A | |
| Mar. 2016 Baseline | $14.0 | $14.6 | $15.2 | $15.9 | $16.8 | $17.7 | $18.8 | $19.9 | $21.0 | $22.3 | $23.7 | N/A | |
*Throughout this paper, ten-year figures reflect the 2017-2026 period.
Economic Projections
CBO’s newest baseline includes an update of its economic projections, which were last made in its January report. Since January, near-term economic growth has slowed, as has CBO’s outlook for projected growth in productivity and labor force participation.
As a result of these and other factors, CBO has revised down projections for GDP growth. For calendar year 2016, CBO estimates growth of 1.9 percent as opposed to the 2.5 percent it previously expected. Unfortunately, CBO now expects slightly slower growth than it projected in January. Over the decade, CBO now projects average real annual growth of 2.0 instead of 2.1 percent. As a result, CBO projects real GDP in 2026 will be 1.6 percent lower than it previously estimated, and nominal GDP will be 2.3 percent lower.
Despite slower economic growth than previously projected, CBO expects the unemployment rate to continue to decline from a 4.8 percent average in 2016 to 4.5 percent by 2017. Beyond that, CBO projects the unemployment rate to stabilize at a bit below 5.0 percent.
Fig. 4: CBO's Economic Projections
| Calendar Year | 2016 | 2017 | 2018 | 2019 | 2020 | 2021 | 2022 | 2023 | 2024 | 2025 | 2026 | Ten-Year | |
|---|---|---|---|---|---|---|---|---|---|---|---|---|---|
| Real GDP Growth | |||||||||||||
| CBO (August 2016) | 1.9% | 2.4% | 2.2% | 1.8% | 1.6% | 1.9% | 2.0% | 2.0% | 2.0% | 2.0% | 1.9% | 2.0% | |
| CBO (January 2016) | 2.5% | 2.6% | 2.3% | 1.8% | 1.9% | 2.1% | 2.1% | 2.1% | 2.0% | 2.0% | 2.0% | 2.1% | |
| OMB (July 2016) | 1.9% | 2.5% | 2.4% | 2.3% | 2.2% | 2.2% | 2.2% | 2.2% | 2.2% | 2.2% | 2.2% | 2.3% | |
| Blue Chip | 1.6% | 2.3% | N/A | ||||||||||
| Federal Reserve | 2.0% | 2.1% | 2.0% | N/A | |||||||||
| Inflation (CPI) | |||||||||||||
| CBO (August 2016) | 1.4% | 2.4% | 2.3% | 2.3% | 2.4% | 2.4% | 2.4% | 2.4% | 2.4% | 2.4% | 2.4% | 2.4% | |
| CBO (January 2016) | 1.3% | 2.3% | 2.4% | 2.4% | 2.4% | 2.4% | 2.4% | 2.4% | 2.4% | 2.4% | 2.4% | 2.4% | |
| OMB (July 2016) | 1.2% | 2.2% | 2.1% | 2.3% | 2.2% | 2.3% | 2.3% | 2.3% | 2.3% | 2.3% | 2.3% | 2.3% | |
| Blue Chip | 1.3% | 2.3% | N/A | ||||||||||
| Federal Reserve | 1.5% | 1.9% | 2.0% | N/A | |||||||||
| Unemployment Rate | |||||||||||||
| CBO (August 2016) | 4.8% | 4.5% | 4.6% | 4.8% | 5.0% | 5.0% | 5.0% | 5.0% | 4.9% | 4.9% | 4.9% | 4.9% | |
| CBO (January 2016) | 4.7% | 4.4% | 4.6% | 4.8% | 5.0% | 5.0% | 5.0% | 5.0% | 5.0% | 5.0% | 5.0% | 4.9% | |
| OMB (July 2016) | 4.8% | 4.7% | 4.6% | 4.6% | 4.7% | 4.7% | 4.8% | 4.8% | 4.8% | 4.8% | 4.8% | 4.7% | |
| Blue Chip | 4.8% | 4.6% | N/A | ||||||||||
| Federal Reserve | 4.7% | 4.6% | 4.6% | N/A | |||||||||
| Interest Rates on 10-Year Treasury Notes | |||||||||||||
| CBO (August 2016) | 1.8% | 2.3% | 2.8% | 3.1% | 3.4% | 3.5% | 3.6% | 3.6% | 3.6% | 3.6% | 3.6% | 3.3% | |
| CBO (January 2016) | 2.8% | 3.5% | 3.9% | 4.1% | 4.1% | 4.1% | 4.1% | 4.1% | 4.1% | 4.1% | 4.1% | 4.0% | |
| OMB (July 2016) | 2.0% | 2.8% | 3.3% | 3.6% | 3.8% | 3.9% | 3.9% | 3.9% | 4.0% | 4.0% | 4.0% | 3.7% | |
| Blue Chip | 1.7% | 2.1% | N/A | ||||||||||
*Federal Reserve numbers reflect Personal Consumption Expenditures (PCE) index, which is on average 0.2 to 0.3 percentage points lower than the Consumer Price Index (CPI).
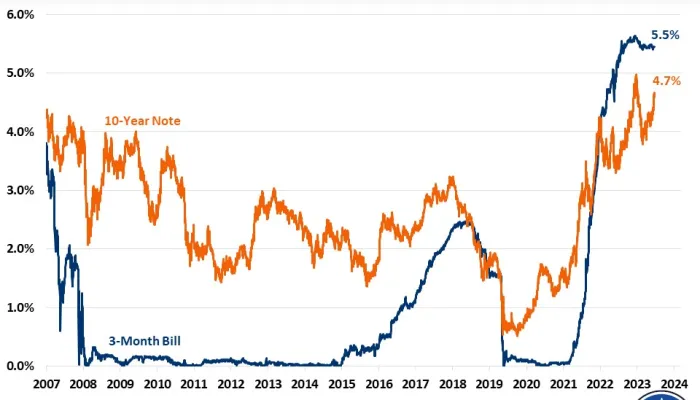
The most significant change in CBO’s economic projections is to interest rates, which are now predicted to be lower in both the short and longer term than CBO projected in January. The ten-year Treasury bill rate is expected to be 1.9 percent in 2016 instead of 2.8 percent due to lower observed rates so far this year and it is now expected to stabilize at 3.6 percent rather than 4.1 percent in the longer run. The three-month Treasury bill rate is expected to ultimately reach 2.8 percent, 0.4 percentage points lower than previous projections and will remain lower throughout the projection period.
Changes in Budget Outlook
Compared to March, CBO projects both debt and the size of the economy will be smaller over the next decade, and as a result it projects the debt-to-GDP ratio in 2026 will be almost identical to prior projections.
More specifically, CBO currently projects debt held by the public will be $23.1 trillion in 2026, compared to its $23.7 trillion projection in March. However, it projected the 2026 debt-to-GDP ratio will be almost identical, at 85.5 percent, compared to 85.6 percent projected in March.
These lower debt levels are the result of a $712 billion reduction in deficit projections from 2017 through 2026, partially offset by $56 billion more in deficits for 2016.
Lower deficits themselves are driven entirely by a reduction in projected interest rates. CBO now expects interest rates on government debt to average 3.3 percent over the next decade – compared to 4.0 projected in March – resulting in over $900 billion less spending from 2017 to 2026.
Accompanying (and likely contributing to) lower projected interest rates is slower economic growth, which CBO projects will partially counter the savings from lower interest payments by reducing tax revenue by $24 billion in 2016 and $428 billion from 2017 to 2026.
Slower growth also means lower GDP – which CBO now projects at $27 trillion in 2026, 2.3 percent below its March projection of $27.7 trillion. This reduction counters any remaining savings from lower interest rates.
Fig. 5: CBO's Legislative, Economic, and Technical Changes from March 2016 Projections
| 2016 | 2017-2026 | |||
|---|---|---|---|---|
| CBO March Deficits | $534 billion | $9,283 billion | ||
| Legislative Changes | $0 billion | -$1 billion | ||
| Economic Changes | $20 billion | -$736 billion | ||
| Lower Interest Rates | -$4 billion | -$905 billion | ||
| Changes in Social Security Spending | $0 billion | -$50 billion | ||
| Lower Corporate Tax Revenue | $12 billion | $247 billion | ||
| Lower Income Tax, Payroll Tax, and Other Revenue | $12 billion | $182 billion | ||
| Changes in Other Spending | $1 billion | -$116 billion | ||
| Debt Service | $0 billion | -$93 billion | ||
| Technical Changes | $36 billion | $25 billion | ||
| Changes in Revenue Projections | $63 billion | $4 billion | ||
| Changes in Medicare Projections | $0 billion | $27 billion | ||
| Changes in Other Spending | -$28 billion | -$53 billion | ||
| Debt Service | $0 billion | $47 billion | ||
| Total Change in Deficits | $56 billion | -$712 billion | ||
| Technical differences between deficits and debt | n/a | $101 billion | ||
| Total Change in Debt in 2026 | n/a | -$555 billion | ||
| Total Change in Debt-to-GDP in 2026 | n/a | -0.1% | ||
| Deficits Projected in August | $590 billion | $8,571 billion | ||
Note: Positives/negatives reflect increases/decreases in deficits. Numbers may not add due to rounding.
CBO also revised its estimates based on other technical and economic impacts, though these were relatively small in magnitude.
Conclusion
CBO’s latest baseline shows that the era of declining deficits is over. Projections show that today’s post–World War II era record-high debt levels growing unsustainably indefinitely unless action is taken.
CBO projects this year’s deficit to rise 35 percent from last year, and they expect trillion-dollar deficits to return by 2024. Meanwhile, debt will reach a new post–World War II era record of 76 percent of GDP at the end of 2016, and rise further to 86 percent of GDP by 2026.
To be sure, CBO does offer some good news: lower projected interest rates mean that nominal debt won’t rise as rapidly as previously projected. Unfortunately, this is partially the result of slower GDP growth, which will not only offset any improvements to the debt but slow income growth for American households. Meanwhile, debt will continue to grow unsustainably as a share of the economy.
As CBO explains, this high and rising debt will increase interest spending, slow wage growth, reduce lawmakers’ flexibility to deal with new challenges, and increase the likelihood of fiscal crisis.
To avoid these consequences, policymakers – and those running for office – should pursue a combination of tax, spending, and entitlement reforms. These should be designed both to slow the growth of the national debt and accelerate growth in the economy, helping both American workers and the budget.
What's Next
-
Image
-
Image
-
