Tax Day 2015: Charts to Explain Our Tax System
In honor of tax day, CRFB and our partners at Fix the Debt released a Tax Day 2015 chartbook yesterday, with ten charts (and one table) that explain federal taxes – who pays them, what they pay for, and how they are collected.
 Fundamental tax reform that simplifies the tax code, encourages growth and raises revenue could go a long way in closing the gap between spending and revenues and putting debt on a sustainable path. Click here to see the full chartbook. We've also highlighted a few of the charts below.
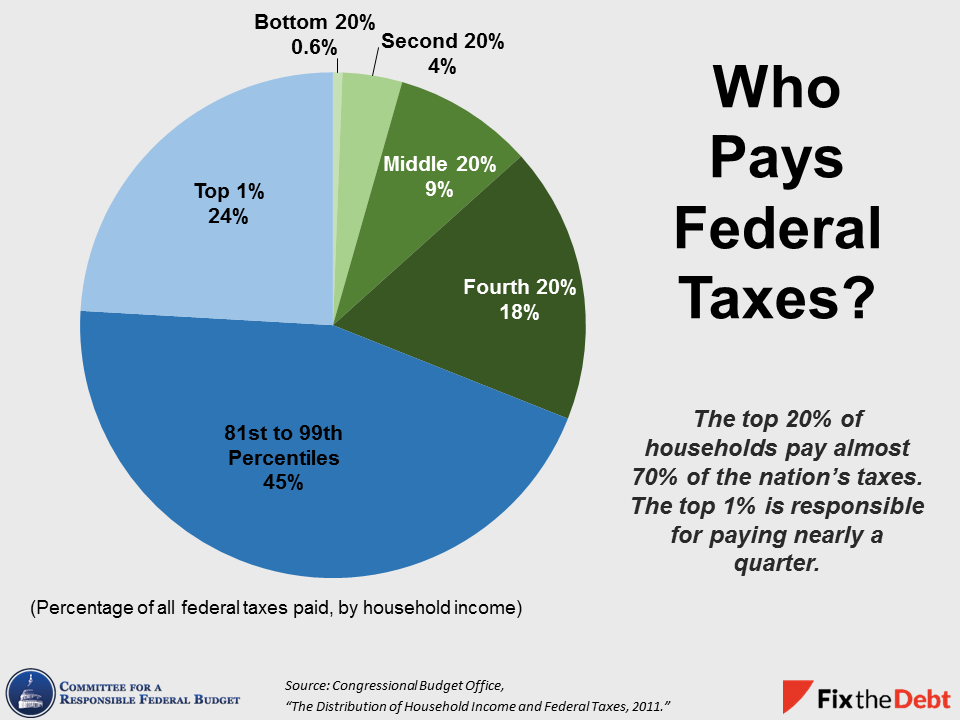
Who Pays Federal Taxes
The top 20 percent of households pay almost 70 percent of federal taxes, with the top 1 percent of earners paying nearly one-quarter. This reflects both the distribution of income and the progressive nature of the current tax code: in 2011, households in the top income quintile received 52 percent of before-tax income and paid about 69 percent of federal taxes, while households in the bottom quintile received 5 percent of before-tax income and paid 0.6 percent of taxes.
 Tweet This Chart
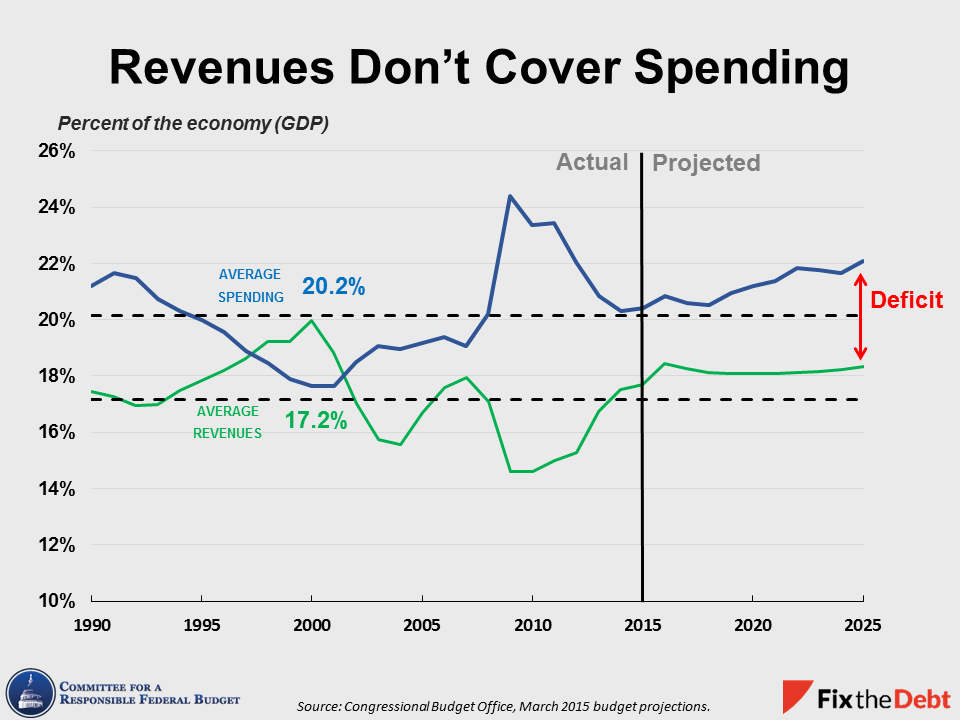
Revenues Are Insufficient for Current Levels of Spending
Since 1990, revenues have averaged 17.2 percent of GDP, while spending has averaged about 20.2 percent of GDP. Yet the aging of the population and growth in mandatory spending programs are set to push federal expenditures well above their historical average. While revenues are projected to increase in the years ahead, the government will still have to rely heavily on deficit financing to meet its current spending obligations.
The Cost of Tax Expenditures Has Grown Substantially
The number of “tax expenditures” – the various deductions, credits, exclusions and other tax breaks in the current code – has grown over time, and is now twice as much as after Congress last reformed the tax code in 1986, after adjusting for inflation.

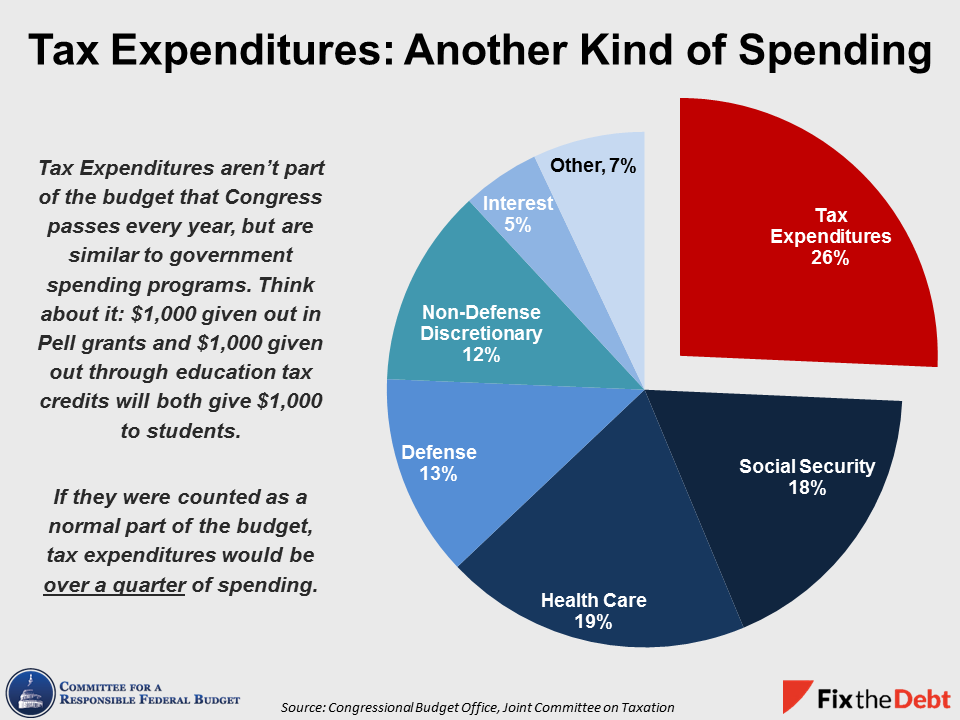
Many of these tax expenditures are similar to government spending programs. This leads many commentators to refer to most tax expenditures as “spending through the tax code” that obscures the true size of government. If tax expenditures were counted as ordinary spending, they would comprise about 26 percent of the federal budget.
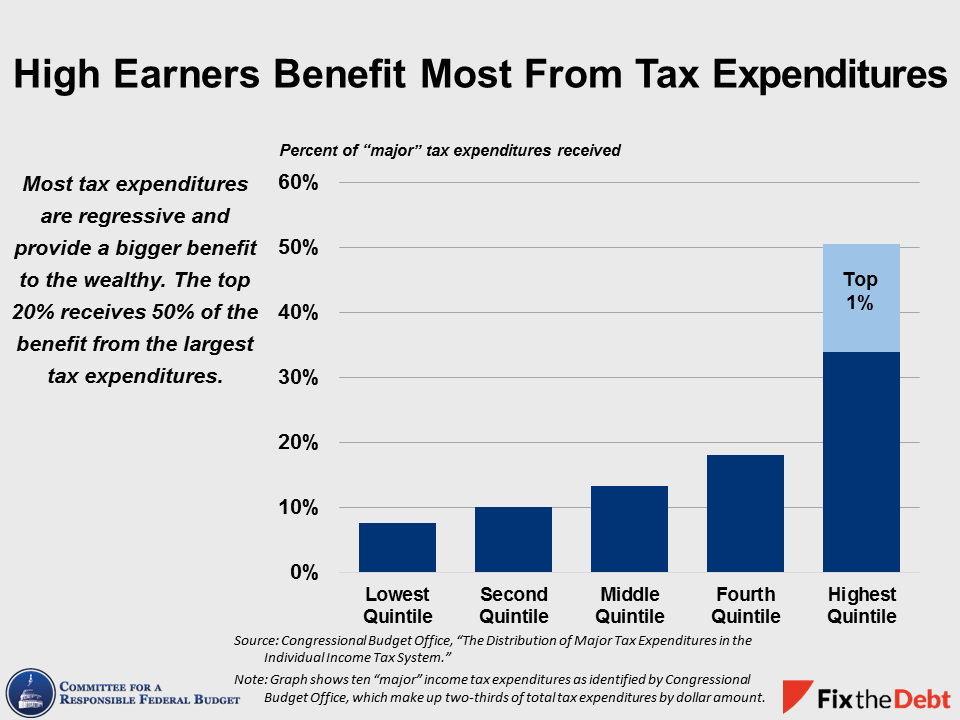
These Tax Expenditures Are Regressive
Most tax expenditures disproportionately benefit high-income taxpayers. Ten of the largest tax expenditures identified by the Congressional Budget Office provide 50 percent of their benefit to the top 20 percent of earners. The top 1 percent of earners claims 16 percent of the benefit.
You can read more about some of the largest tax expenditures in the current code by checking out our Tax Break-Down series, which analyzes individual tax provisions and reviews how much they cost, who they benefit, and how they can be reformed.
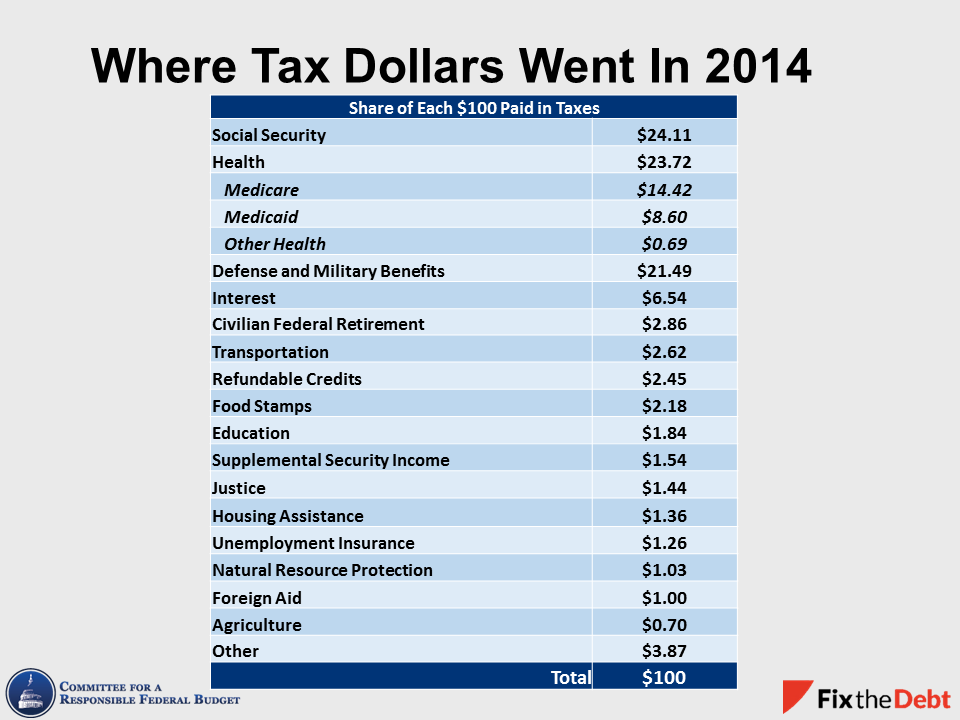
And One Table: The Taxpayer Receipt
Our last chart shows where an illustrative taxpayer's money goes. The majority of tax dollars go towards popular functions like national defense, Social Security, and Medicare. Functions like foreign aid and federal employee retirement benefits comprise a relatively small share of the federal budget. For every $100 paid in taxes, more than $6 goes to paying interest payments on the debt. Importantly, taxpayers would have to pay an additional $16 for every $100 they paid in taxes in order to pay for all federal spending in 2014.
Now that we've all paid our taxes, it is worth remembering the basic facts about our current income tax system. As lawmakers consider whether to overhaul the current tax code, it is important to recognize the tough choices and trade-offs necessary for any meaningful tax reform.