A Closer Look at the Mid-Session Review
On Monday, the Office of Management and Budget released its re-estimate of the President's Budget in the Mid-Session Review. OMB's new estimates of the President's plan look worse than they did in April, largely due to change in economic projections. The MSR projects debt to be 75.4 percent of GDP in 2023, compared to 73.0 percent of GDP in the original projections. This is much higher than CBO's scoring of the President's Budget, which estimated it would reduce it to just below 70 percent of GDP by 2023 and roughly comparable to CRFB's Realistic baseline based on CBO's assumptions (at 75.5 percent of GDP in 2023, but on an upward path).
The most important goal for lawmakers is to put the debt on a downward path as a share of the economy, and like the House and Senate, the President's Budget would do so under OMB's revised estimates, although to a lesser extent than in April.
While total receipts in dollars are lower than in the original budget projections, the lower level of output in the Mid-Session Review projections means that revenues make up a greater share of GDP in the MSR projections. Revenues are projected to rise from 17.3 percent in 2013 to 20.1 percent by 2023. Spending levels as a share of GDP are slightly higher than in the original budget, falling from 22.0 percent in 2013 to 21.5 in 2017 before settling just over 22 percent of GDP by the end of the decade. The caveat about the smaller economy applies to the spending side as well.
| Spending and Revenue Under the President's Budget (Percent of GDP) | ||||||||||||
| 2013 | 2014 | 2015 | 2016 | 2017 | 2018 | 2019 | 2020 | 2021 | 2022 | 2023 | Ten-Year | |
| Revenue | ||||||||||||
| MSR | 17.3% | 18.0% | 18.5% | 18.8% | 18.9% | 19.1% | 19.3% | 19.5% | 19.8% | 19.9% | 20.1% | 19.2% |
| Budget | 16.7% | 17.8% | 18.6% | 18.8% | 18.8% | 18.9% | 19.2% | 19.4% | 19.6% | 19.8% | 20.0% | 19.1% |
| Spending | ||||||||||||
| MRS | 22.0% | 22.4% | 22.0% | 21.9% | 21.5% | 21.5% | 21.9% | 22.0% | 22.2% | 22.4% | 22.2% | 22.0% |
| Budget | 22.7% | 22.2% | 21.8% | 21.6% | 21.3% | 21.2% | 21.5% | 21.6% | 21.7% | 21.9% | 21.7% | 21.6% |
Source: OMB
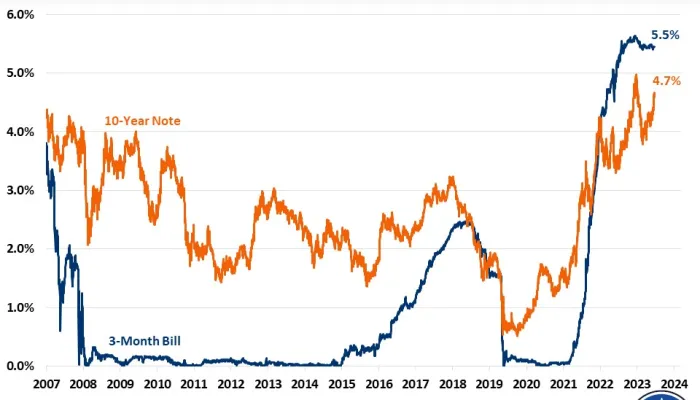
Driving much of the revisions were changes in the OMB's economic projections. While the MSR expects unemployment to fall more quickly, reaching 5.4 percent in the fourth quarter of 2017 compared to 2018 in the original budget, output is expected to grow more slowly in the near term. Real GDP growth is only 2.0 percent in the MSR compared to 2.3 percent the original projections for 2013. As a result of the slower rate of growth, output is expected to be nearly $400 billion lower by 2023. Inflation and interest rates rise slightly more slowly in the MSR than in the original budget projections, offsetting some of the increase in net interest payments.
| Legislative, Economic, and Technical Changes | ||
| Area | 2013-2018 Savings/Costs(-) | 2013-2023 Savings/Costs(-) |
| President's Budget Deficit | -$2,784 | -$6,244 |
| Legislative Changes | $3 | $3 |
| Economic and Technical Changes | $56 | -$321 |
| Revenue | -$81 | -$319 |
| Medicare | $1 | -$29 |
| Medicaid | -$62 | -$131 |
| Social Security | $57 | $88 |
| Other Spending | $137 | $46 |
| Net Interest | $4 | -$34 |
| Mid-Session Review Deficit | -$2,725 | -$6,562 |
Source: OMB
The deficit in 2013 is actually expected to be $214 billion lower, due to $65 billion in greater than expected tax revenue, $43 billion in less discretionary spending due to sequestration, $71 billion in higher collections from dividend payments from Fannie Mae and Freddie Mac, and other smaller changes. However, this short-term revision is outweighed by a $540 billion increase in deficits over the following ten years.
There has been little legislation passed since the release of the April budget except for the FY 2013 Continuing Resolution passed in March. The CR increased 2013-2023 deficits by $3 billion, with a reduction in the 2013 deficit offset by an $8 billion increase over the following ten years. Overall, the bulk of changes in the Mid-Session review were on the revenue side due to slower economic growth in the next few years. 2013-2023 revenues are $319 billion lower in the MSR while 2013-2023 primary spending is $32 billion lower. Spending on Medicare is higher, primarily due to higher than expected Medicare Advantage enrollment. For Medicaid, spending is higher due to higher expected base year (2013) spending, which pushes up projections of Medicaid over the next years. This is partly offset by lower spending on the Medicaid expansion and lower health care cost growth. Social Security spending is lower primarily due to lower inflation and thus smaller cost-of-living adjustments (COLAs).
Just as we argued that lawmakers and the public should not overreact to downward revisions in CBO's May baseline, the MSR does not change the overall budget picture very much. Under realistic assumptions, the debt remains on a clear upward path and more will need to be down on debt and deficits. We still have more work left to do.
What's Next
-
Image
-
Image
-
