BPC Takes a Detailed Look at the Ryan Budget
The Bipartisan Policy Center has a detailed look at the Ryan budget, comparing it on various budget metrics to the most recent Debt Reduction Task Force plan ("Domenici-Rivlin 2.0"). The numbers show not only overall spending, revenue, deficits, and debt numbers but also how spending in different parts of the budget compares.
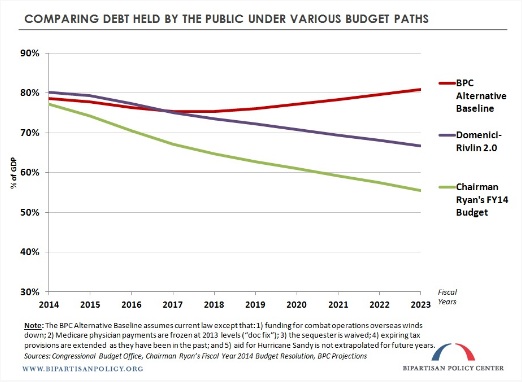
The first two charts show significant improvement in both the Ryan budget and Domenici-Rivlin 2.0 debt and deficits compared to their current policy baseline. On the debt comparison, the authors say:
Under Chairman Ryan’s budget, the ratio of debt to our economy, or gross domestic product (GDP), would decline to 55 percent by 2023. Notably, this is lower than the debt levels achieved by either the BPC’s Domenici-Rivlin 2.0 or Simpson-Bowles commissions (both of which reduce the debt to roughly 65-70 percent of GDP by 2023), and it is significantly lower than that under the BPC Alternative Baseline* (81 percent).
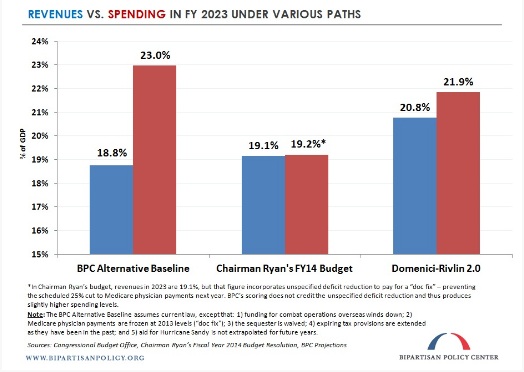
This graph compares revenue and spending levels in 2023 for the two plans and the current policy baseline.
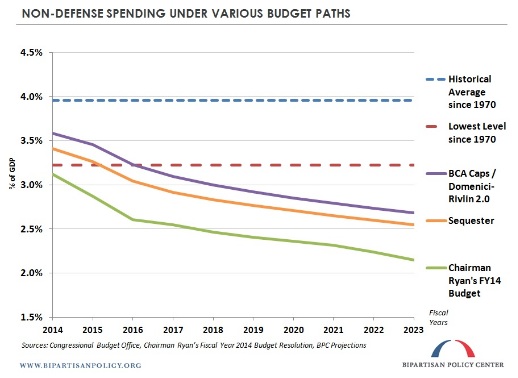
BPC also shows the plans' effects on health care and discretionary spending. For discretionary spending, they also show the 40-year historical average and low for defense and non-defense spending compared to what the plans call for. BPC describes the Ryan plan's Medicare changes as follows:
Within the ten-year window, Chairman Ryan only proposes one reform specific to Medicare that produces savings. The budget would increase means testing in Parts B and D of the program, resulting in upper-income beneficiaries paying higher premiums for their physician and prescription drug coverage. This is similar to the proposal from President Obama in his FY 2013 budget.
A larger reform of the Medicare program would begin for those becoming eligible in 2024 or later. The House GOP budget introduces a competitive bidding system, backstopped by a cap on per-beneficiary spending growth of 0.5 percentage points faster than the economy (GDP+0.5%). This reform is very similar to the proposal that he advanced in December 2011 with Senator Ron Wyden (D-OR), except that the annual growth cap is now set at GDP+0.5% instead of GDP+1%.
Below is the graph of Medicare, showing that Ryan's changes within the ten-year window are small compared to the ones beyond it.

This graph shows the difference in non-defense discretionary spending.
BPC's analysis is well worth checking out for context about what the Ryan budget plans to do. In addition, if last year is any indication, BPC will be doing the same thing with other budget plans as they come out, so be on the look out for detailed comparison of the relative priorities of each budget from BPC.
What's Next
-
Image
-
Image
-
